


Crude Oil Price Forecast Talking Points:
- The ONE Thing: WTI continues to falter on an absolute and relative basis after OPEC headlines about increased production align with risk-aversion on fresh US tariffs. The WTI-Brent spread has blown out to three-year extremes with August contracts showing a $10/bbl spread. The discount of WTI has widened on extreme US production.
- Thursday’s EIA Crude Oil Inventory Report showed a surprise draw,but record production and bottlenecks stole the show in favor of short-term bears.
- WTI Crude Oil Technical Analysis Strategy: A pull-back is in play with resistance favored between $68.50-70.15 per barrel.
- Access our recent Crude Oil Fundamental Forecast here
Key Technical Levels For WTI Crude Oil:
Resistance: $68.50-70.15 per barrel – 38.2-61.8% retracement of 9.65% decline from last week’s high
Spot: $67.11/bbl
Support: $65.80-$64.33 per barrel – May 28 low & 61.8% Fib extension from Wednesday’s high
WTI-Brent Spread Blows Out On Record US Production
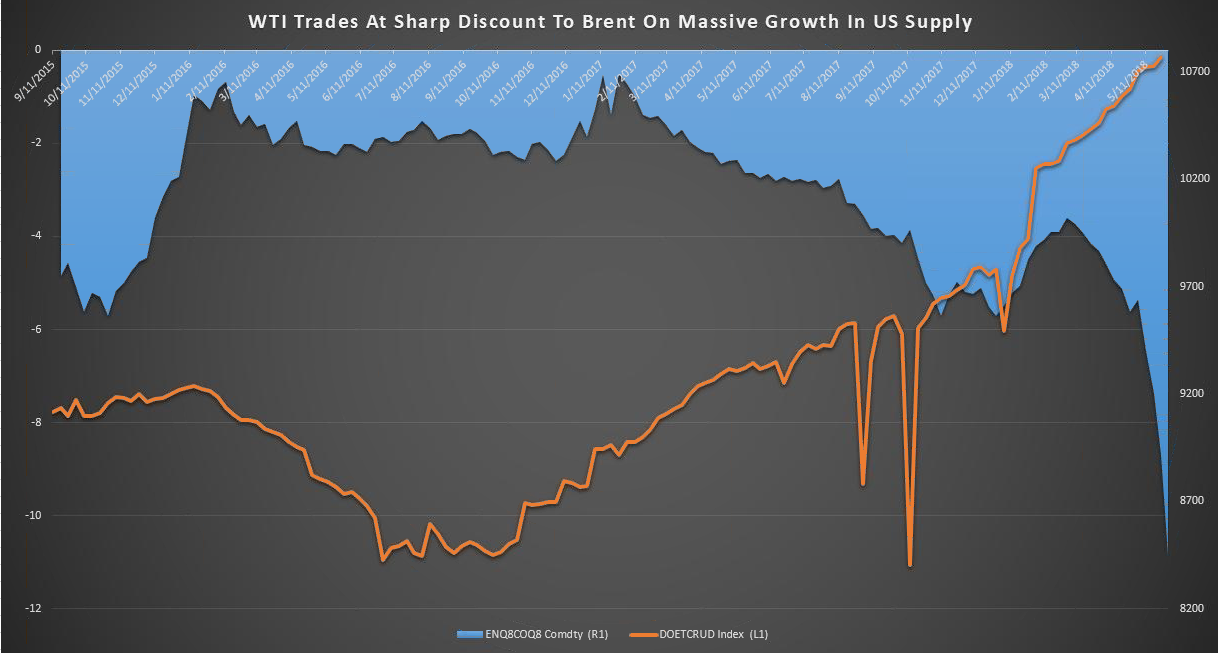
Data source: DoE, Bloomberg
WTI crude oil is set to trade lower than anticipated in future months against the global benchmark Brent. Particularly, when you look at the August WTI-August Brent spread between futures contracts, you'll see a $10 spread as displayed on the chart above in blue. The orange line is displaying the increase in US production, which is at record levels.
Crude is lower by 5% over the last five days on factors that extend beyond OPEC.
The multiple factors taking Crude Oil lower
Crude continues to slump on a handful of factors: Things were going so well for crude bulls until OPEC spoke up. Many investors would say OPEC simply provided what the market needed for tightening signs in the physical market was extreme. Tightening is visualized by looking at the premium a near-dated contract I the futures market receives relative to a later dated contract, and the premium was hitting historic levels.
OPEC came out and said they’d likely add supply to the market, which makes sense after Iran sanctions and the lack of supply from Venezuela and Angola led to unexpected tightness. However, the oil market is also dealing with a strengthening dollar that raised the international price of WTI crude. However, it’s likely too early to say the late-cycle economic boom that typically aligns with rising oil is over.
Technical outlook for WTI crude: move toward $62/bbl in view
After falling from a rising wedge, WTI crude now is making an impulsive move lowr that could take the pair toward $62/bbl, which was a pivot seen earlier this year.
As mentioned above, traders see Brent trade at the highest premium to WTI since 2015 after a broad build of US inventories as reported by the weekly EIA Inventory Report. Given the premium that Brent is now enjoying, OPEC obviously had the needed incentive to roll-back previously held production curbs that may drive the entire curve lower.
Unlock our Q2 18 forecast to learn what will drive trends for Crude Oil in a volatile Q2
Recommended Reading: 4 Effective Trading Indicators Every Trader Should Know
More for Your Trading:
Are you looking for longer-term analysis on Crude Oil and other popular markets? Our DailyFX Forecasts for Q2 have a section for each primary currency, and we also offer an excess of resources on USD-pairs such as EUR/USD, GBP/USD, USD/JPY, AUD/USD. Traders can also stay up with near-term positioning via our popular and free IG Client Sentiment Indicator.
Forex Trading Resources
DailyFX offers a surplus of helpful trading tools, indicators, and resources to help traders. For those looking for trading ideas, our IG Client Sentiment shows the positioning of retail traders with actual live trades and positions.
Our trading guides bring our DailyFX Quarterly Forecasts and our Top Trading Opportunities, and our real-time news feed has intra-day interactions from the DailyFX team. And if you’re looking for real-time analysis, our DailyFX Webinars offer numerous sessions each week in which you can see how and why we’re looking at what we’re looking at.
If you’re looking for educational information, our New to FX guide is there to help new(er) traders while our Traits of Successful Traders research is built to help sharpen the skill set by focusing on risk and trade management.
---Written by Tyler Yell, CMT
Tyler Yell is a Chartered Market Technician. Tyler provides Technical analysis that is powered by fundamental factors on key markets as well as trading educational resources. Read more of Tyler’s Technical reports via his bio page.
Communicate with Tyler and have your shout below by posting in the comments area. Feel free to include your market views as well.
Discuss this market with Tyler in the live webinar, FX Closing Bell, Weekdays Monday-Thursday at 3 pm ET.
Talk markets on twitter @ForexYell


