Brent Crude Oil Price Forecast Talking Points:
- The ONE Thing: Bears are losing reasons to fight the trend. The latest developments from U.S.-Iran shows that supply shocks appear likely in addition to potential overtightening from the OPEC+ alliance while options additionally show a premium being paid to protect against upside shocks.
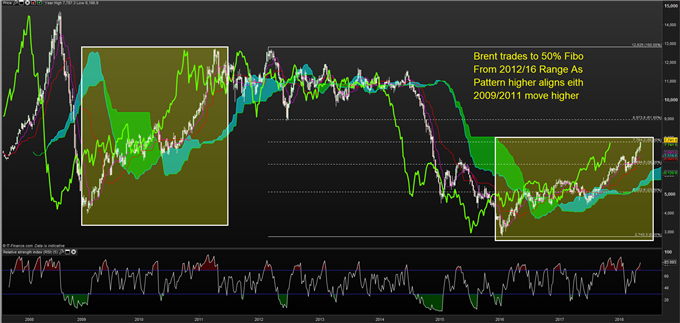
- Brent Crude Oil Technical Analysis Strategy: Despite a potentially stretched move, Brent crude has approached the 50% Fibonacci level of the 2012/2016 price range at $77.75/bbl. A move higher here would next target $89.70/bbl, which is currently supported by the fundamental backdrop.
- Access our recent Crude Oil Fundamental Forecast here
Not all commodities are treated equally. Some are kings where others are being treated like paupers. Take gold and oil for example. Recently, an attendee on my FX Closing Bell webinar encouraged me to take a look at the ratio of gold priced in barrels of Brent crude.
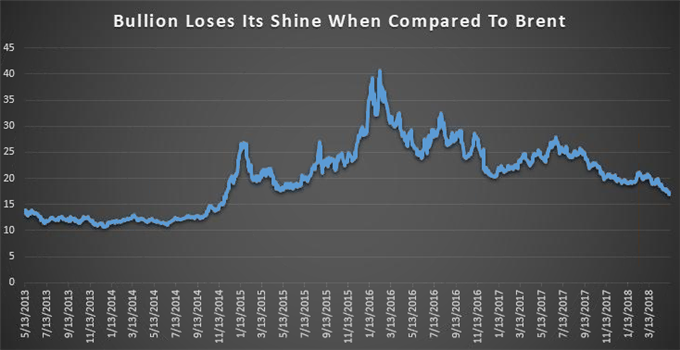
Gold Has Not Been This Unattractive Relative To Crude Oil Since 2014

Data source: Bloomberg
The chart above shows a ratio of Gold priced in the front-month contract of Brent crude oil futures. Brent, of course, has been buoyed by supply fears and growing demand while the return to a low volatility environment has been particularly bad for Gold bulls.
Recently, the ratio has dropped to the lowest levels when Brent was trading north of $100/bbl. In addition to low volatility, the ratio (and gold in general) has been taken lower by a strengthening US Dollar out of a year-plus long downtrend, higher US interest rates and a stable global economy that shows a non-yielding rock doesn’t deserve the premium it once does.
In addition to the lack of a haven trade, the bid in crude is showing the opposite development in the demand is there as supply is dropping.
The Lottery Ticket Trade Is Back – Options Jump on $100 Brent Calls
A rise in December options for Brent at $100/bbl jumped this week after the imposition of US sanction on Iran, OPEC’s third largest producer per Bloomberg. Deep out of the money calls are not a sure-thing as they’re often purchased when possibility and low-prices make a trade worthwhile.
Unlock our Q2 18 forecast to learn what will drive trends for Crude Oil in a volatile Q2
Technical Analysis – Brent Crude Oil Stays In Bullish Standing

Chart Source: Pro Real Time with IG UK Price Feed. Created by Tyler Yell, CMT
The chart above shows Brent crude at a major technical juncture when looked at in the context of the 2012-2016 move from $128-$27/bbl.
The key level is the 50% Fibonacci retracement of that range that sits at $77.75.
A close above this level, and if done on a weekly basis would likely further discourage bears from holding the trade and could see an eventual move toward the 61.8% Fibonacci level of the same range at $89, which would align with how the options market is seeing crude.
Short-term support can be found at the range of the 9- & 26-day midpoint at $75.11-$74.17/bbl. These are Ichimoku levels applied to daily trading data that have provided a clear view of bullishness since mid-March.
Not familiar with Ichimoku? You’re not alone and you’re in luck. I created a free guide for you here
New to FX trading? No worries, we created this guide just for you.
More for You:
Are you looking for longer-term analysis on Crude Oil and other popular markets? Our DailyFX Forecasts for Q2 have a section for each primary currency, and we also offer an excess of resources on USD-pairs such as EUR/USD, GBP/USD, USD/JPY, AUD/USD. Traders can also stay up with near-term positioning via our popular and free IG Client Sentiment Indicator.
Forex Trading Resources
DailyFX offers a surplus of helpful trading tools, indicators, and resources to help traders. For those looking for trading ideas, our IG Client Sentiment shows the positioning of retail traders with actual live trades and positions.
Our trading guides bring our DailyFX Quarterly Forecasts and our Top Trading Opportunities, and our real-time news feed has intra-day interactions from the DailyFX team. And if you’re looking for real-time analysis, our DailyFX Webinars offer numerous sessions each week in which you can see how and why we’re looking at what we’re looking at.
If you’re looking for educational information, our New to FX guide is there to help new(er) traders while our Traits of Successful Traders research is built to help sharpen the skill set by focusing on risk and trade management.
---Written by Tyler Yell, CMT
Tyler Yell is a Chartered Market Technician. Tyler provides Technical analysis that is powered by fundamental factors on key markets as well as t1rading educational resources. Read more of Tyler’s Technical reports via his bio page.
Communicate with Tyler and have your shout below by posting in the comments area. Feel free to include your market views as well.
Discuss this market with Tyler in the live webinar, FX Closing Bell, Weekdays Monday-Thursday at 3 pm ET.
Talk markets on twitter @ForexYell


