US crude oil talking points:
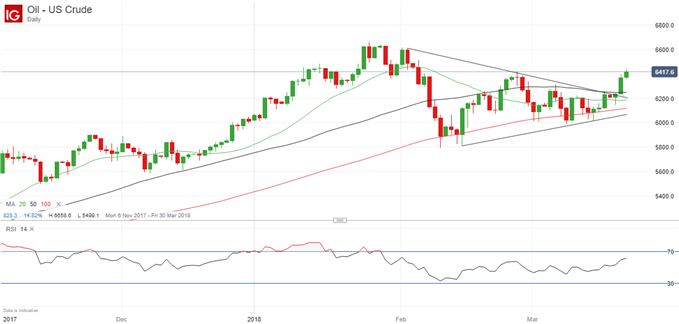
- The price of US crude oil has broken decisively above resistance from a trendline connecting the February highs.
- That’s a bullish development, although further resistance could delay a stronger advance.
Learn how to trade like an expert by reading our guide to the Traits of Successful Traders
Check out the top trading opportunities for 2018 on the DailyFX Trading Guides page
Oil breaks trendline resistance
The price of US crude oil has broken decisively above resistance from a downward-sloping trendline joining the highs touched on February 2 and February 26, suggesting that further gains are in prospect.
US Crude Oil Price Chart, Daily Timeframe (November 6, 2017 to March 21, 2018)

The target now is the series of highs reached in late January and early February, all around the $66.30 per barrel mark, implying some $2 of upside potential from current levels. To the downside, there is plenty of support from the 50-day moving average, the trendline joining the February highs, the 100-day moving average and then another trendline joining the February/March lows.
All lie between $62.50 and $60.50 so the downside should be limited near-term.
Fundamentals positive for oil price too
This bullish technical picture is supported by the fundamentals too, with the US Dollar still lower than at the turn of the year despite its recent relative stability. Tensions remain high in the Middle East, there is speculation about US sanctions on Iran, demand is healthy and Venezuela’s output is falling.
In addition, US crude stocks fell by 2.7 million barrels in the week ended March 16 to 425.3 million as refineries boosted output, according to the American Petroleum Institute. The US Energy Information Administration also reported an unexpected drop in US crude inventories last week; it reckoned they fell by 2.6 million barrels whereas analysts had predicted a 2.6 million barrels increase.
However, there is one important factor that could curb the oil price’s advance: a continuing rise in US output that so far shows few signs of tailing off.
Resources to help you trade the forex markets
Whether you are a new or an experienced trader, at DailyFX we have many resources to help you: IG Client Sentiment data, analytical and educational webinars hosted several times per day, trading guides to help you improve your trading performance, and one specifically for those who are new to forex.
--- Written by Martin Essex, Analyst and Editor
Feel free to contact me via the comments section below, via email at martin.essex@ig.com or on Twitter @MartinSEssex


