


Access Free Oil Trading Guide from DailyFX Analysts HERE !
Talking Points:
- Crude Oil Technical Strategy: Price trend support (50/52) favors eventual upside, watching resistance
- A Return of Liquidity Refreshes S&P 500, Dollar and Oil Bulls
- Developing Themes & Technical Views in The Commodity Landscape
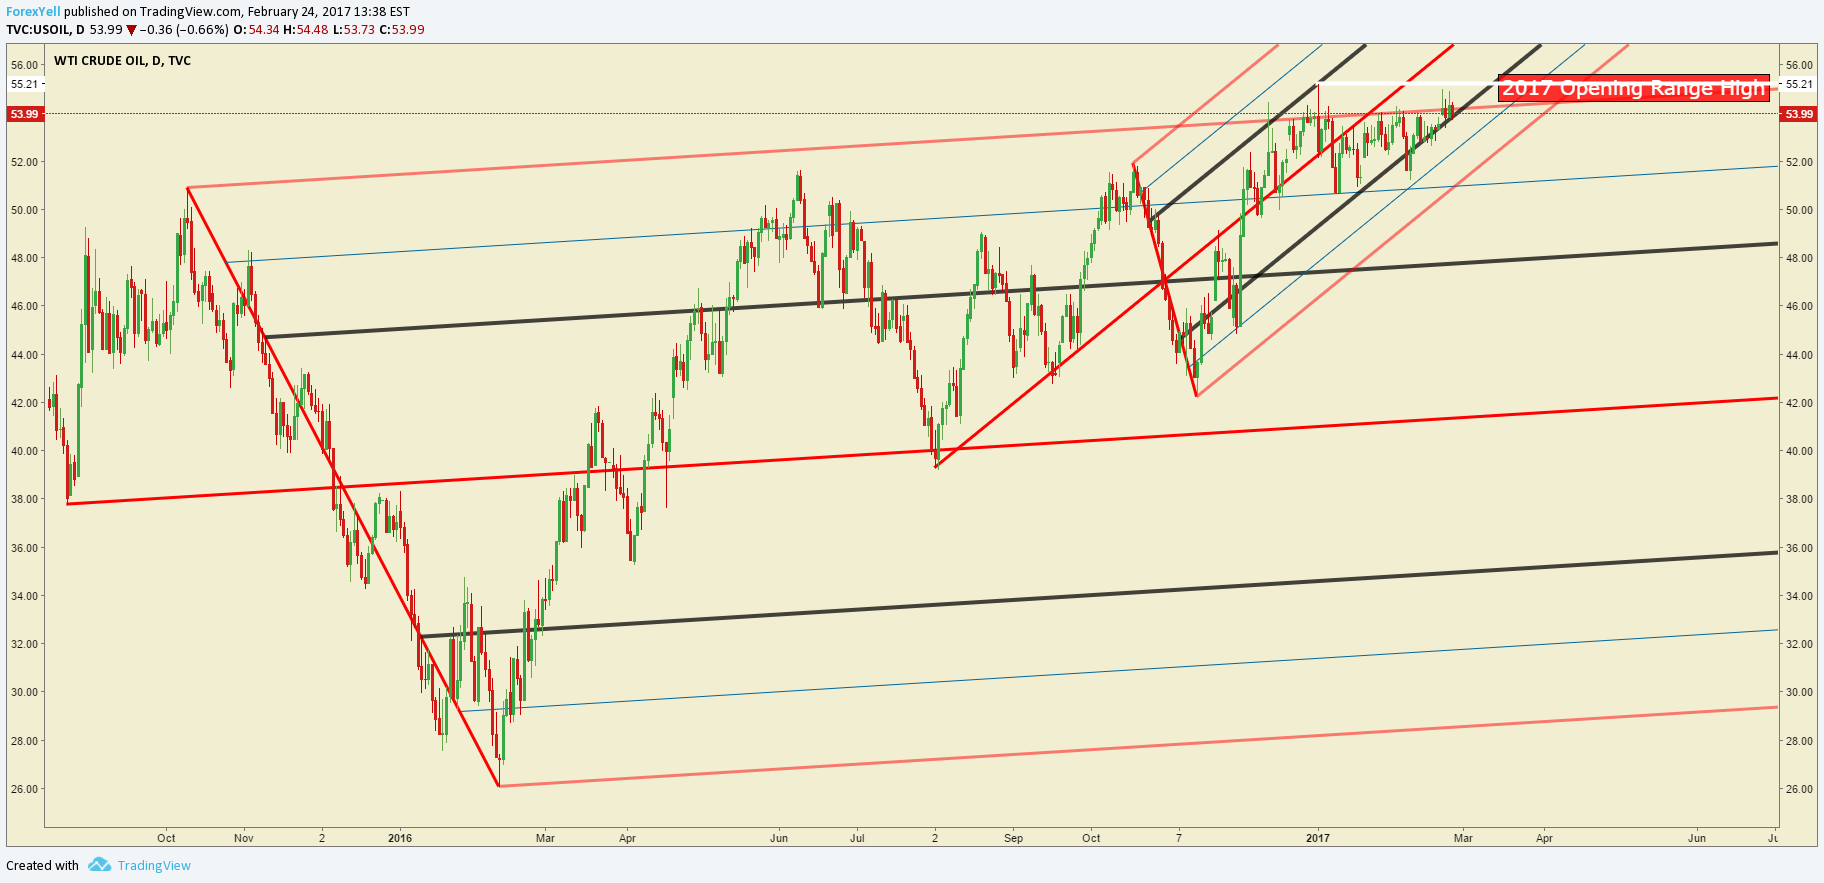
The price of Crude Oil Continues to run up against long-term resistance when looking at the 2017 Opening Range High of $55.21/bbl and Andrew’s Pitchfork that is drawn off of three key pivots in 2015 and 2016. When looking at the long-term chart, the low volatility can be worrisome. We recently shared how last week; Crude Oil posted its lowest weekly trading range in 13-years.
The volatility has caused many to play a strangle options strategy that benefits off of lower volatility with an expectation over the next six months that price would remain between $45/65 per barrel. However, while we’re at resistance, we should be cognizant of the bullish forces behind the price of crude Oil.
The last two times OPEC cut production in 2003 and 2008; the price rose significantly over the following years. Additionally, as OPEC pulls back market supply, despite the US quickly gaining market share, we see Forward Prices in Crude Oil demonstrating that supplies should eventually tighten. We also saw this week a premium for the front-month contract relative to the 12-month contract, which is known as backwardation and happens when traders sell later months to lock in gains and can communicate a tightening in supply in the coming months.
The first chart speaks for itself as it shows that the price is moving into long-term resistance with little volatility. This doesnot equal a sell-signal but should be watchedif the price breaks below the lowermedian channel line. A sharp break below the shorter-term APF would argue that we’ve been knockedout of the current Bullish bias market. Conversely, a sharp move higher through the long-term Pitchfork Resistance could be another indication, along with the Forward Price data that we’re about to see a continuation of the persistent move higher. This wouldlikely turn many of the Strangle option trades unprofitable, but such is life in markets.
17-Month Chart Crude Oil: Andrew’s Pitchfork Applied
Below is the main chart that has had our focus as it has encouraged us to favor a drift higher. We recently broke above the key lowerhigh at $54.29 in the opening range of 2017. This happened on the breakout of the triangle pattern that also encouraged us to focus higher, and we’ll continue to do so until we break below key support of the Ichimoku Cloud near $48/bbl and the polarity zone of $50/52 that has long held our attention.
One other point on the chart below, keep an eye on RSI(5). We remain in Bullish Territory, but the RSI has been quiet, which aligns with the low price volatility. I am watching for a spike higher as that would likely be a long-term validation that the trend will continue, and we should keep our focus higher.
D1 Crude Oil Price Chart: Crude Oil Has Broken Above Pre-Defined Evening Star Resistance at $54.29

Chart Created by Tyler Yell, CMT Courtesy of TradingView
---
Key Levels Over the Next 48-hrs of Trading as of Friday, February 24, 2017

T.Y.
To receive Tyler’s analysis directly via email, please SIGN UP HERE


