


Access Free Oil Trading Guide from DailyFX Analysts HERE !
Talking Points:
- Crude Oil Technical Strategy: Price triangulation above support (50/52) favors eventual upside
- Crude Oil – Triangle Possibility from January 3rd
- Resistance/ Bullish validation set at corrective double top at $54.29/31 per barrel, evening star top
Crude Oil has been absent of any decent volatility, but that doesn’t stop the fact that the background picture developing could still be favoring a strong rise before the end of Q1 2017. We have had two back-to-back weeks of massive US Inventory builds out of Cushing OK, but the price of Crude Oil remains above our key support zone highlighted as a yellow rectangle on the chart below in the $50/52 price range.
The background behind what is happening in Crude is much more encouraging than what you see currently on the Crude Chart. The price of other industrial commodities like Copper and Iron Ore has led the view of the Reflation Trade, which shows that growth and possibly inflations expectations are on the rise, which could boost Oil.
The price of Copper recently broke above the early November high, when many Commodities, namely Gold turned tail and eventually dropped in H2 2016 by nearly 16%. The move higher in other commodities alongside the price stability in Crude Oil could be indicative that there is amarket belief that the cuts that OPEC is currently adhering to are doing long term good to the stability of the Oil market. While we do not forecast a $100/bl of oil, the technical picture and Intermarketanalysis do seem to show that a move to the lower $60/bbl range is believed to be very feasible.
We still need to see a breakout above the current triangulation pattern or sideways consolidation that has been taking place since we rang in the New Year. The price level that we continue to watch is a corrective lower high, and likely a Triangle ‘B’ wave near $54.30. A break above this level would show that a strong price move could be underway as we’ve seen in other commodities and could be even more pronounced if the recent break higher in the USD on Janet Yellen comments fails to hold recent support.
A break below the $50/52 zone would cause me to reconsider the Bullish view. However, consolidation continues to favor eventual continuation of a trend, which has been higher since the handle of the Pitchfork in August 2016.
When a market fails to drop in light of seemingly Bearish news like massive US inventories, it could be the fuel is spilled and the bullish move is just waiting for the right spark, which could cause the price to move higher with volatility not yet seen in 2017. That would be a common play out of a triangle pattern, which tends to drain the enthusiasm of the prior move by consuming time in the consolidation pattern before eventually advancing the trend.
Bottom line, while the price is wallowing in the low-volatility environment, keep alerts on a daily close above $54.30 or below $50/ bbl. Either break could be indicative of the next big move in Oil with a decent bit of long-waiting volatility to add.
D1 Crude Oil Price Chart: Crude Oil Volatility Is Subdued, Price Bounce From Support Favors Upside
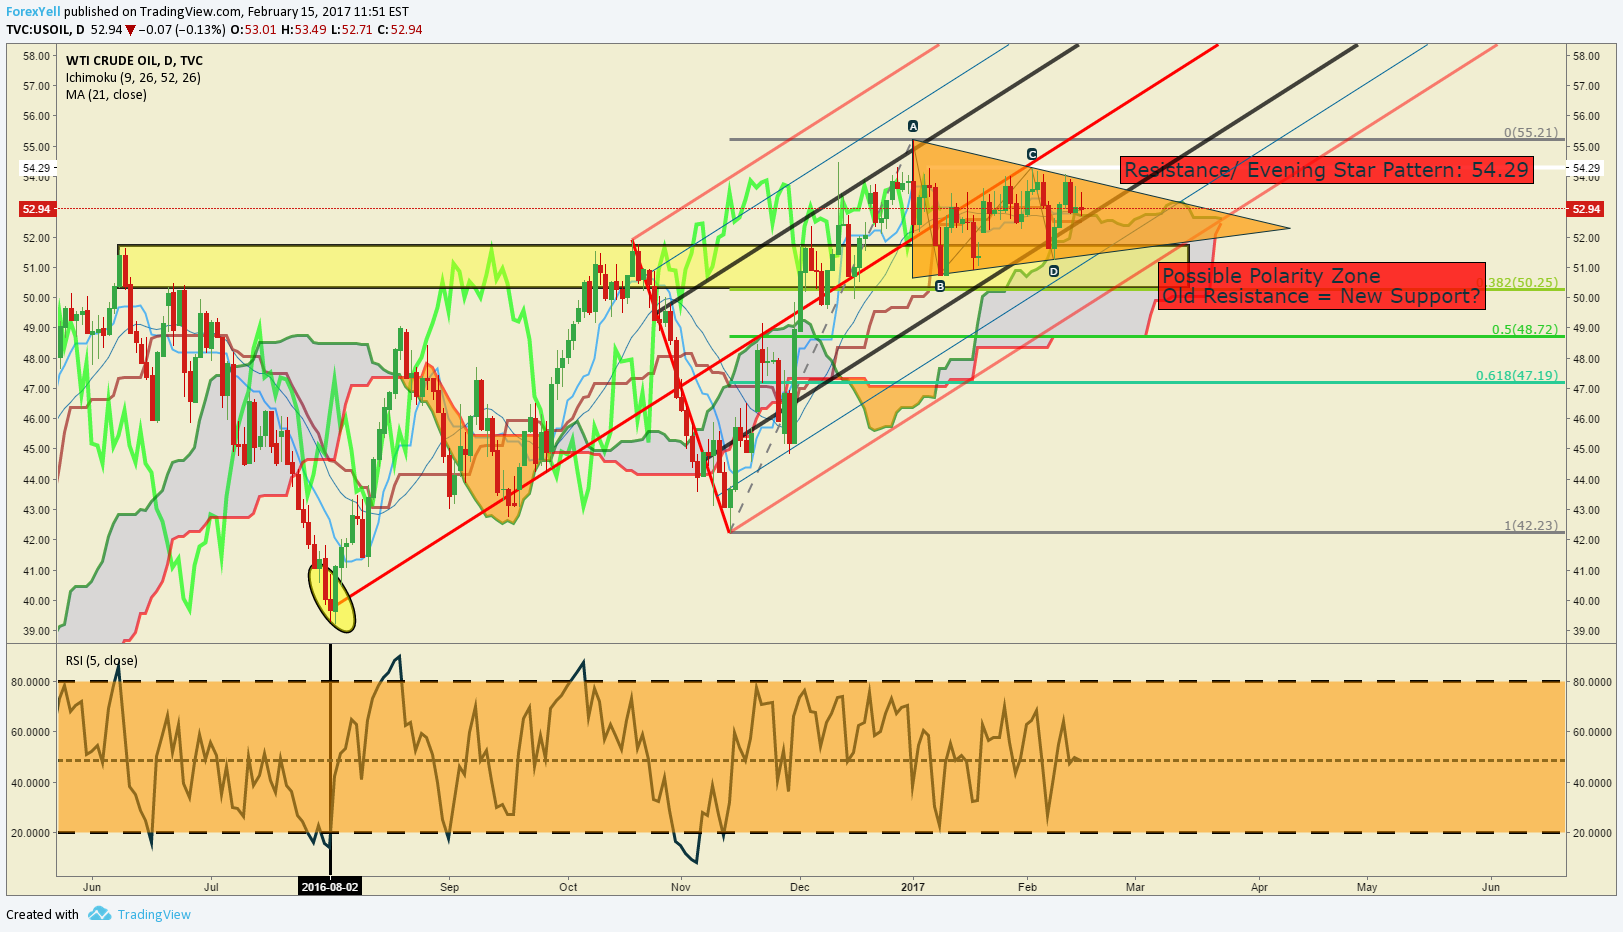
Chart Created by Tyler Yell, CMT Courtesy of TradingView
---
Key Levels Over the Next 48-hrs of Trading as of Wednesday, February 15, 2017

T.Y.
To receive Tyler’s analysis directly via email, please SIGN UP HERE


