


Access Free Oil Trading Guide from DailyFX Analysts HERE !
Talking Points:
- Crude Oil Technical Strategy: Price remaining above support (50/52) favors eventual upside
- COT-Crude Oil Record Spec AND Hedger Positions
- Resistance set at corrective double top at $54.29/31 per barrel, evening star top
Crude Oil has become the poster-child for low volatility. As we head into the second week of trading in February, we have yet to break out of the macro opening range set in the first two weeks of January. The macro opening range high on January 03 is $55.21/bbl and the macro opening range low on January 11 is $50.75/bbl.
Given the extreme positioning divergence between speculators and hedgers, it is worth waiting to see which level, support or resistance will break. Should either level give way, and one side of the market fail to hold their position and reverse, we could see a strong follow through. In addition to the extreme positioning as displayed on the chart below, the Oil market is sitting at extremely low volatility right now, and the price is above long-term support near $50/52 per barrel.
Crude oil – new week and new record position
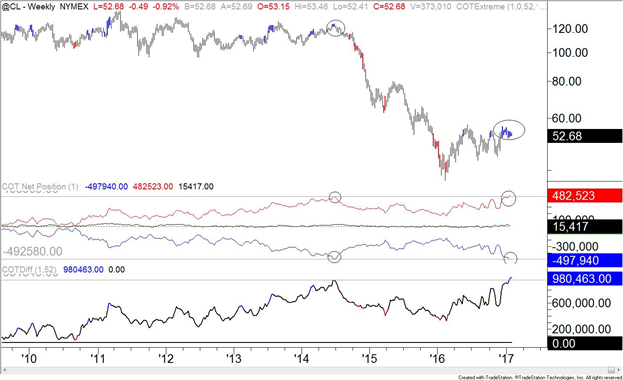
Image Source: COT-Crude Oil New Week and New Record
The belief that low volatility begets high volatility or stability begets instability will likely have a chance to prove itself in the crude Oil market. After the post-OPEC cut confirmation in late November followed by non-OPEC cuts in early December, the price has been flat. However, the active economic backdrop has led to large bets being placed on the next big swing. The low volatility causes me to discount the current move down to support. Only a break below $50/bbl on increasing volatility per ATR(5) on the Daily chart would seem to indicate a large reversal of the February-January retracement is in the works.
The chart support that the price currently sits above is the daily Ichimoku Cloud, Andrew’s Pitchfork, and polarity zone. None of these should be taken lightly, and the confluence of the three shows me that the burden of proof remains on the bears. A failure to break below this zone of support would favor a continuation of the choppy uptrend with a possible capituation of the sellers getting out of the trade providing a boost for longs toward the lower $60-target that I’ve long favored on the retracement of the 2014-2016 breakdown.
D1 Crude Oil Price Chart: Crude Oil Volatility Is Subdued, Price Above Support Favors Upside Bias

Chart Created by Tyler Yell, CMT Courtesy of TradingView
---
Key Levels Over the Next 48-hrs of Trading as of Tuesday, February 07, 2017

T.Y.
To receive Tyler’s analysis directly via email, please SIGN UP HERE


