


Access Free Oil Trading Guide from DailyFX Analysts HERE !
Talking Points:
- Crude Oil Technical Strategy: Price stability above support (50/52) favors upside
- COT-Crude Oil Record Spec AND Hedger Positions
- Resistance set at $54.29/bbl, evening start top
The price of Crude Oil appears at odd with the sentiment, which we recently reported via the CFTC Commitment of Traders report showed that speculators are loading into long positions at a record clip. However, the record spread between commercial hedgers and speculative investors has hit extreme levels, but the price has failed to breakout.
The first chart is taken from the article, COT-Crude Oil Record Spec AND Hedger Positions by Jamie Saettele, CMT. The price of Crude Oil current month futures contract, CL1, with net positioning per the COT shown below the price.
The worrisome observation from the chart is that the last time we saw such extremes in positioning was the summer of 2014 when Crude Oil would last trade above $110/bbl before diving to a low of $26/bbl in February 2016. Sentiment and positioning analysis is helpful, but not predictive, but it is worth noting that a breakdown that takes the price below the key level we will soon discuss could be indicative of a larger, albeit smaller breakdown in Crude Oil price like developed in H2 2014-Q1 2016.
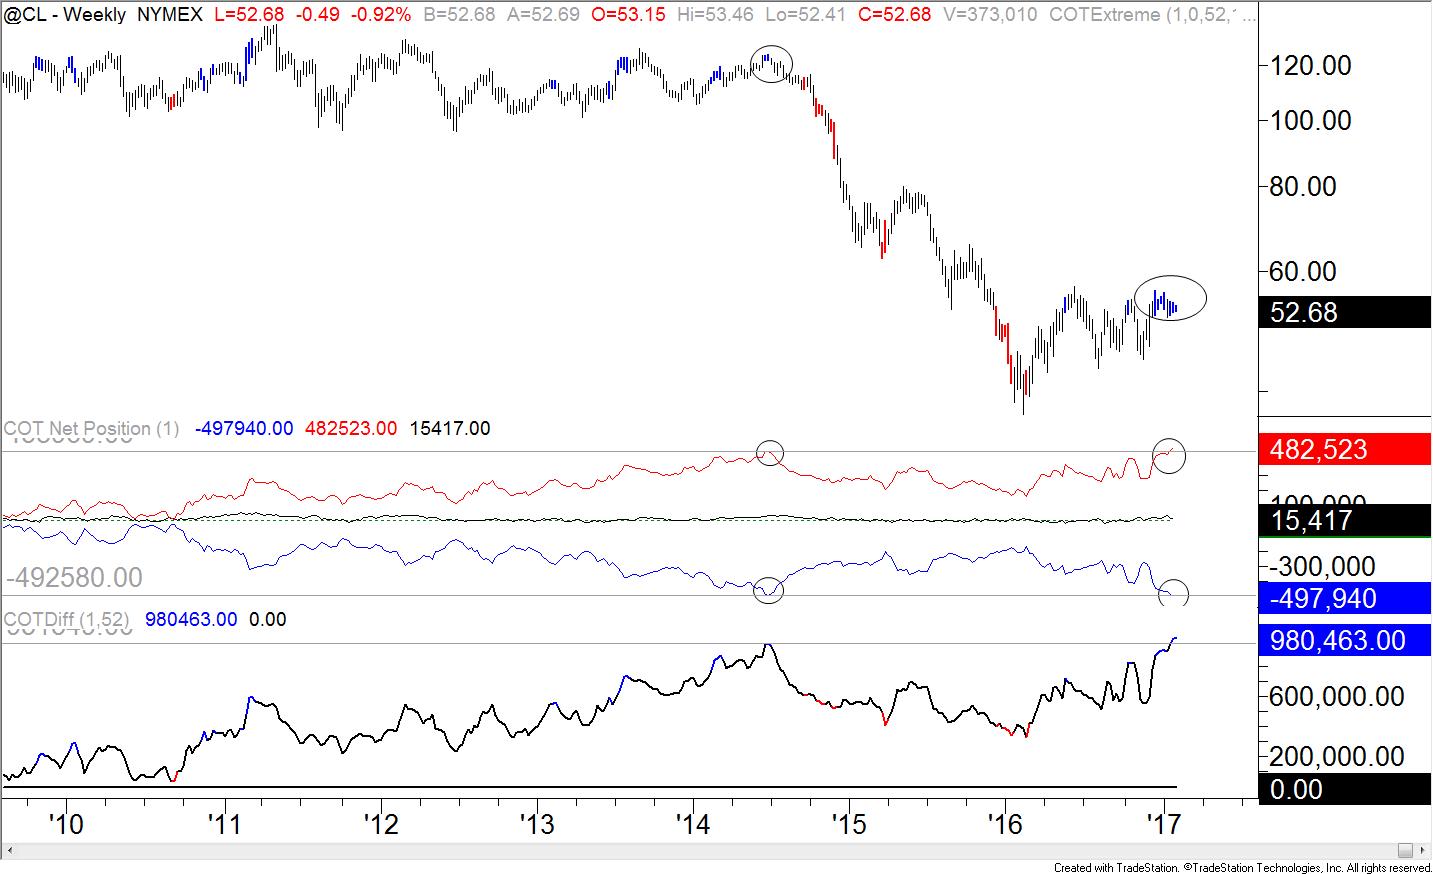
Image Source: COT-Crude Oil Record Spec AND Hedger Positions by Jamie Saettele, CMT, Sr. Technical Strategist
There has been an impressive amount of compliance by OPEC, but the stability in price in the lower half of $50/bbl appears to show this was fully priced in. It’s difficult to say what could kick off the next Bull trend or the next Bear breakdown, but many are watching the USD for clues ahead of the FOMC for the possible next big move in Crude. However, it’s worth noting the Crude Oil and the US Dollar has recently moved to a positive correlation relationship.
The positive correlation has been blamed on the strong bullish positions that hedge funds have in both USD & USOIL (see chart above.)
When looking at the chart below, you can see a highlighted zone that focuses on a level that was resistance that now appears to be supported. The price also looks to be trading higher within a Bullish Pitchfork drawn off the early August closing low and the October and November price extremes. The Daily Ichimoku cloud is also added to the chart and aligns with the lower quarter of the Pitchfork. The two zones of support should prevent traders from getting Bearish if price holds above these levels in anticipation of a downtrend beginning.
From a momentum perspective, you can see that there was a strong move down in Oil at the start of the year that took RSI(5) down to the oversold region. However, the price did not break below the Polarity Zone on the chart, which could be indicative that the next big move is higher rather than lower despite the positioning spread explained above.
Naturally, a break below the Ichimoku Cloud and Andrew’s Pitchfork lower bound would align with a breakdown below the polarity zone that has my focus. Until we can check off all three events as completed, I will await the sideways action in Crude Oil in anticipation of an eventual breakout that will be validated on a break above $54.29.
D1 Crude Oil Price Chart: Crude Oil Volatility Is Subdued, Price Above Support Favors Upside Bias

Chart Created by Tyler Yell, CMT Courtesy of TradingView
Key Levels Over the Next 48-hrs of Trading as of Tuesday, January 31, 2017

T.Y.
To receive Tyler’s analysis directly via email, please SIGN UP HERE


