


Access Free Oil Trading Guide from DailyFX Analysts HERE !
Talking Points:
- Crude Oil Technical Strategy: USOIL focus turns lower to polarity zone 51.50/50.50
- USD Over-extension could provide further support for crude oil into 2017
- Crude Oil Price Forecast: Early 2017 Volatility Pattern Arises
The oil market may have provided the first legitimate head fake in markets for 2017. At the beginning of Tuesday’s trading session, the first official trading day in 2017, as many markets were observing New Year's Day on Monday, Oil began trading to 18-month highs by trading above $55 a barrel. The initial move higher had credibility as OPEC’s deal compliance seemed to be coming to fruition on initial reports of firm’s production after the official start of the production cuts agreed to in Vienna in late November.
Shortly after midmorning trade, oil had completely reversed earlier gains and eventually closed nearly 3% lower on the day. The aggressive reversal aligned with the volatility pattern we mentioned in the late December article the discussed in developing rising wedge pattern that can either be in ending diagonal preceding sharp losses or a leading diagonal that would favor aggressive gains. Either way, volatility could be a mainstay in the energy market in January 2017.
Looking at the chart below, the critical point appears to be the polarity zone where we look for past resistance to turning in the current support. The polarity zone occurs between $51.50 a barrel down to $50.50, and if the market found support at the sound, we would favor continued gains in Q1 2017. However, if the market fails to hold above the polarity zone and eventually trades back below $50 a barrel where the market found support in early December, we would begin to favor the ending diagonal view. An ending diagonal would have us anticipating a test of support at the late November high near $49 a barrel followed by the November 29 high or low near $45 a barrel.
The chart below shows a Modified-Schiff Pitchfork that has done an excellent job of framing price action. Tuesday’s turnaround happened at internal channel resistance near $55 a barrel. Initial support within the bullish channel takes place at the median line within the polarity zone that currently stands at $51.40 a barrel.
Should the price continue to hold above this level on a closing basis, we will favor a move toward the top of the channel near $59/60 per barrel.Should a reversal develop in the price of Crude Oil, we would be on the watch for the price to break down through the rising support levels mentioned above at $49/45. Only a break below this zone would take us from Bullish to Neutral. Until then, we will favor eventual upside heading into 2017. Regardless, we will expect further volatility in this key market.
H4 Crude Oil Price Chart: Crude Oil Volatility Opens 2017 with Focus Now On Prior Resistance at $51
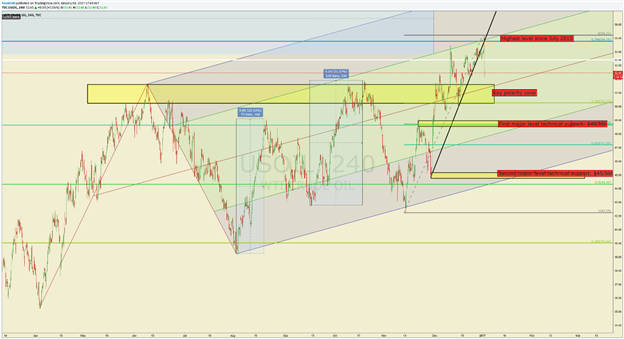
Chart Created by Tyler Yell, CMT Courtesy of TradingView
Join Tyler Monday’s at 3 pm EST to discuss key global macro trends like Oil (Free Registration)
Key Levels Over the Next 48-hrs of Trading as of Tuesday, January 3, 2017

T.Y.
To receive Tyler’s analysis directly via email, please SIGN UP HERE


