


Access Free Oil Trading Guide from DailyFX Analysts HERE !
Talking Points:
- Crude Oil Technical Strategy: Fibonacci Resistance Zone Expected to Resist Price Advance
- Record Call Volume & Significant Open Interest Shows Aggressive Volatility Ahead
- Iranian Oil Minister Helping Market Get Excited About Renewed Chances For a Deal
By looking at the options market alone, you know something big is likely about to happen with the price of Oil. Volatility is anticipated to be high regardless of OPEC’s outcome whether they cut the production of Oil, and set a cap on production for the first time in eight years or whether they continue to produce at well. Recent comments from the Iranian Oil Minister, Bijan Namdar Zanganesh, have increased confidence following Russian Oil Minister’s comments last week about a highly probable deal coming to pass. These comments have given Oil a boost toward a pre-defined level of resistance to be discussed below.
Interested In a Quick Guide about OPEC, Click Here
In addition to the encouraging comments about a, “highly probable” outcome for a production cut, the Options Market has shown high anticipation in the Oil Market. Open interest, which measures both long and short exposure in the Oil market ahead of the Vienna OPEC meeting is at its highest levels since 2007 as per the U.S. CFTC. Additionally, we’ve seen a record number of call volume, which is less of a commitment than outright longs while outright shorts in the Brent Oil have reached their highest level in more than two years.
The aggressive positioning helps to show that the price-risk may favor the upside given the calls would be exercised and the aggressive short positioning would be unwound. However, a failure to fulfill the agreement in September to cut collective output from 34 million to 32.5-33 million will no doubt see the price under pressure, and some wondering if a move toward a $30-handle is underway.
D1Crude Oil Price Chart: USOIL Continues To Find Resistance At Fibonacci Retracement Zone

Chart Created by Tyler Yell, CMT Courtesy of TradingView
As the CLZ6 futures contract rolls over from December to January, the volatility is picking up ahead of the OPEC-meeting and into key zones of support & resistance.
The price of Crude Oil (CFD: USOil) or CL1 has reached the top mark of our pre-defined resistance zone at $48.19/bbl. This predefined level marks the 61.8% Fibonacci Retracement of the October-November Range. As explained earlier, there is a lot of bearish exposure in Brent (UKOil) as well as contingent, derivative contracts on both Oil markets should the deal get reached.
In addition to the price action around pre-defined resistance, it’s worth keeping an eye on the Trendline drawn off the first higher low in early April should a breakdown occur on no-deal. If the bullish environment remains, and the price continues above this trendline, we’ll be on the watch for further upside. Another component that could help the price of Oil stay above the trendline is the pull-back in the Dollar Index that we’ve seen to start the holiday week in the U.S.
Join Tyler Monday’s at 3 pm EST to discuss key global macro trends like Oil (Free Registration)
In addition to the Fibonacci zone that occupies $45.90-$48.19/bbl, we also see the top of the Andrew’s Pitchfork that should still be respected until price definitively uses the top channel as support on a move higher. The support zone worth watching is $43/42 per barrel. A break below this important zone that houses the post-election low and Trendline could indicate the risk of a double-top is upon us.
Given the importance of the OPEC deal, as shown via the aggressive open interest in the options market, correlations may place less than a role as a driving force. Therefore, we should not get too excited about USD weakness, should it persist until a deal of lack thereof is finalized in late November.
Either way, we have the zones to watch regardless of how price breaks.
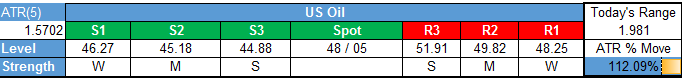
Key Levels Over the Next 48-hrs of Trading as of Monday, November 21, 2016
T.Y.
To receive Tyler’s analysis directly via email, please SIGN UP HERE


