


Access Free Trading Guides from DailyFX Analysts HERE !
Talking Points:
- Crude Oil Technical Strategy: Long-Term Chart Is Exciting Oil Bulls
- Traders Are Most Bullish Since January On OPEC Accord per CFTC
- Inventories & Hurricanes Help Push Oil Toward $50
For the fifth straight week, U.S. Oil supplies have surprised markets who expected a build in inventories due to either lack of demand or oversupply. The price of Crude Oil still has not traded above $50, but the positive data out of the US such as Wednesday’s impressive Non-Manufacturing-ISM data that came in at 57.4 vs. expectation of 51.7.
Track short-term Crude Oil price levels and patterns with the GSI indicator!
The inventory data aligns nicely with the recent accord reached in Algiers where OPEC decided for the first time in eight years to curb production after producing at record levels in October. Since the accord was reached, Crude Oil is higher by over 10% and shows little signs of slowing down. One seasonal effect worth keeping an eye on is the Hurricane coming up the Atlantic Coast in the United States. Production should be marginally effected at worst, as the path is steering clear from the Gulf of Mexico where production is abundant.
In the last note, we shared the development in institutional positioning that was the largest increase in long positions in WTI since January. This bullish positioning is an aggressive reversal from the bearish sentiment that had not been seen since September 2015 in recent CoT readings. A breakout above $50 could see the move higher in Crude Oil prices run even further.
Trading View W1 Crude Oil Price Chart: Head & Shoulder’s Bullish Pattern Aligns With Bullish Ichimoku
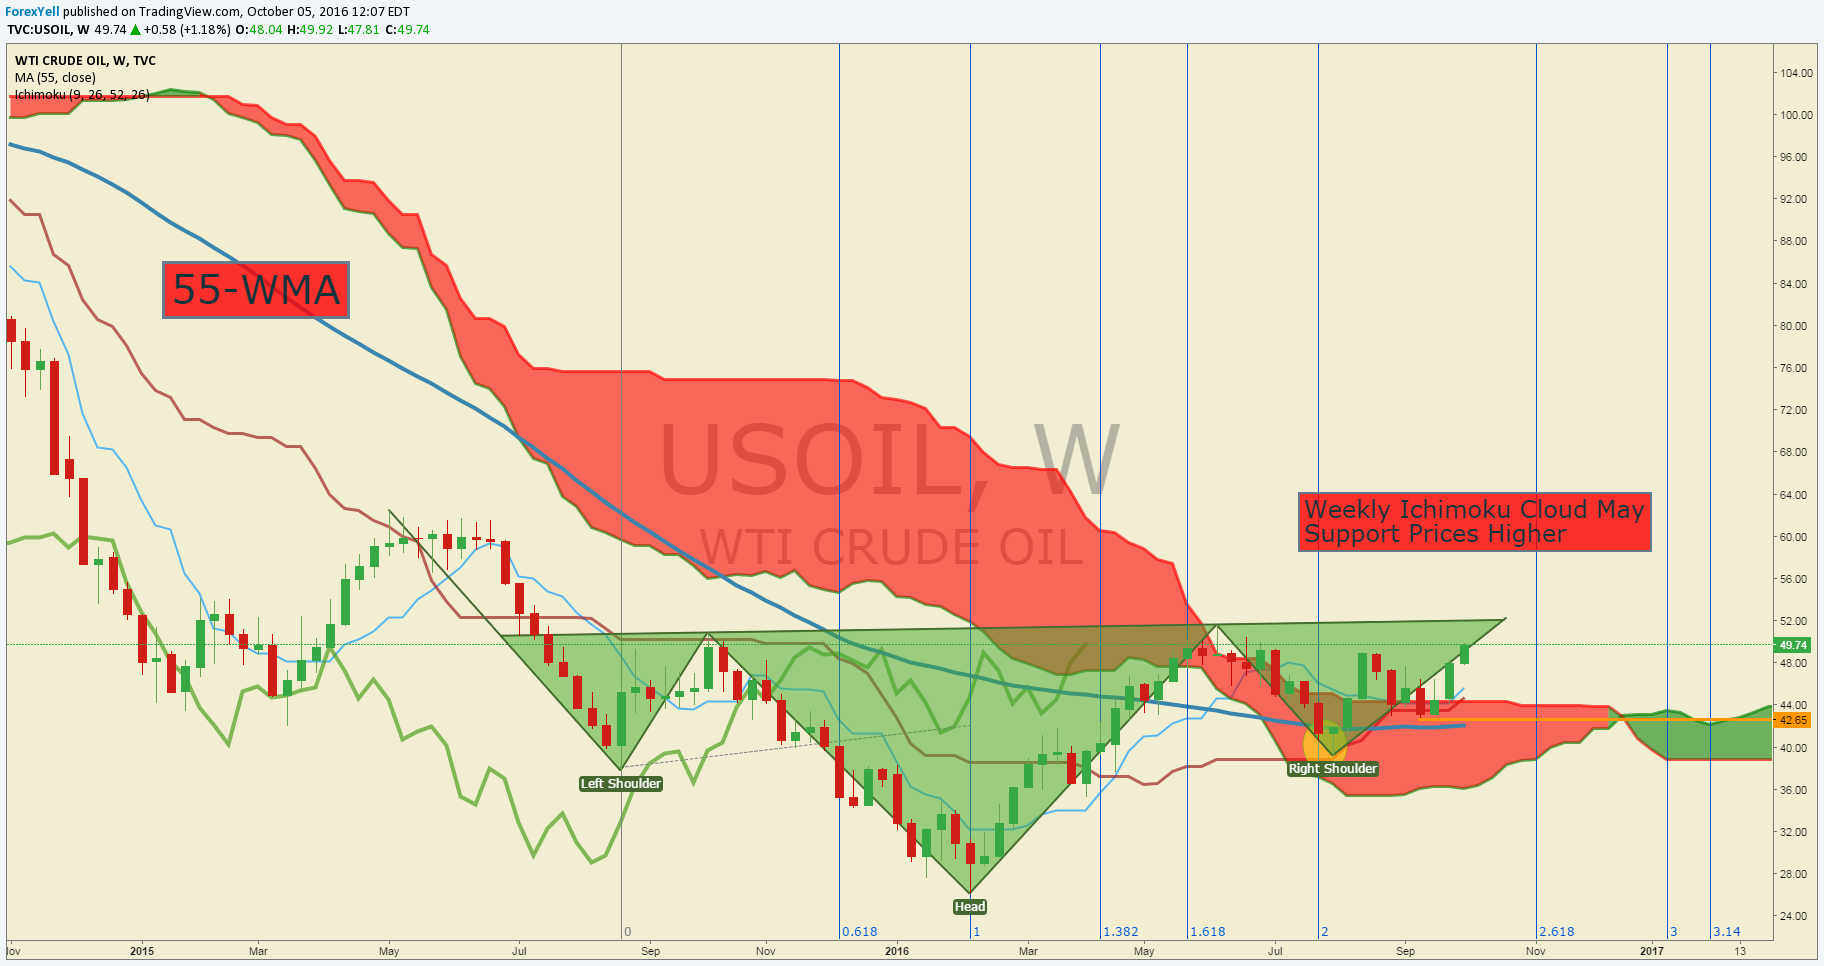
The chart above shows an emerging technical story for the Bulls that has many excited for the upcoming months the first time in a while. The Weekly Oil chart above shows the headline for the long-watched Bullish Head & Shoulders pattern sitting near $52/bbl. In addition to the Bullish Price Pattern is the Weekly Ichimoku Cloud. There are two key components that Ichimoku-based traders look to before declaring a Bull trend and that is both price and the lagging line pushing above the cloud. Naturally, the weekly chart is the last of charts to catch up, and it typically shows longer-term trend changes.
The lagging line is simply the close of the current weekly candle pushed back 26-periods. It would be expected meet resistance at the cloud top if the breakout continues, but even that would take us ~20% higher to $60/bbl.
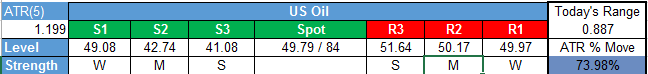
As of Wednesday, the price of Crude Oil is closing in on the June high of $51.64/bbl. As noted above and before, if the price of WTI can clear the June high, the targets worth focusing on are in the mid-$60/lower-$70/bbl range. However, shorter-term swing traders may look for confirmation of a full-on Bullish break with a tag of the Weekly R2 Pivot of $50.96/bbl.
Lastly, you can also see the price resting above the 55-WMA, which favors a breakout happening higher as opposed to lower. Swing-Support sits at $42.65 or ~14% below current market. Only a break below there would turn my views from Bullish to Neutral.
Key Levels Over the Next 48-hrs of Trading As of Wednesday, October 5, 2016
T.Y.
To receive Tyler’s analysis directly via email, please SIGN UP HERE


