


To receive Tyler’s analysis directly via email, please SIGN UP HERE
Talking Points:
- Crude Oil Technical Strategy: Oil Backing Off From Resistance As Warned
- Dollar Direction and Oil Demand Continue To Be Key Themes In Oil Rally, But Dollar Is Now Winning
- Sentimental Trading System Buy Signal Remains, But Is Cooling Down
Access Our Free Q3 Oil Outlook As Oil's Best Quarter Looks For Confirmation
Dollar demand has increased dramatically since Friday afternoon where Federal Reserve Vice President Stanley Fischer encouraged markets to be on the watch for the upcoming Non-Farm Payroll announcement on September 2 that could play a role in whether the Fed hikes soon. The price and price trends of Oil, which is priced in USD is inversely correlated to the USD so recent USD strength over the last 72 hours has put pressure on the energy market.
Track short-term Crude Oil price levels and patterns with the GSI indicator!
There are still a handful of encouraging developments in the Oil market that could accelerate the price appreciation of Crude should the Fed fail to hike, or the US Data take another turn lower, and the US Dollar weakness continues.
Wood Mackenzie recently informed markets that Oil discoveries are at their lowest since 1947 per conventional oil discovered. There is still solid production due to technologies like shale, but this could be setting the stage for a supply shortage in years to come, though we must be patience. As the old saying goes, nothing cures low prices like low prices and the lack of spending due to Oil’s collapse has set the stage for E&P companies only to stay with the winning areas like the Permian Basin in the United States.
Another development that has been overshadowed by a very strong US Dollar is that Iraq threw their support behind an OPEC freeze. Iran looks to be supportive of a freeze, but there is still doubt as to whether a unanimous agreement can come together.
H4 Crude Oil Price Chart Moving Lower In Price Channel, Awaiting Strength Later

The chart above shows the price action in US Oil over the summer. For now, the price looks to be ranging from support of ~$40/bbl and resistance of ~$50/bbl. The price also looks to be trading in a corrective price channel since peaking on August 21. A break above corrective resistance at $48.43 would be enough to encourage technically based traders to rejoin the Bull trend.
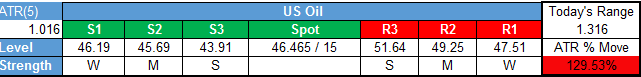
Last note, we discussed how on a longer-term / weekly chart, a framework for a Bullish Head & Shoulder Pattern has looked set. A legitimate breakout would be validated by a break of the price of Crude Oil above $51.64/bbl. If the price broke out and sustained above the highlighted range near ~$50/bbl, we would favor a move to $66.16, which would be 61.8% extension of the Head & Shoulder’s range and $75.60/bbl, a 100% extension, and traditional Head & Shoulder’s target.
For now, the stronger US Dollar will likely provide better prices to buy (read: likely heading lower) with a support zone in focus between $~46-$44/bbl. Only a move below there and a stronger US Dollar would put our medium term Bullishness on the shelf.
The key support that would deflate the confidence of the 20%+ August trend would be a break below the higher low of $41.08/bbl from August 11. A breakdown below there could be the first confident sign that price will continue to wallow lower in the falling channel drawn on the chart.
Bottom Line:
The US Dollar is not going to allow the next big move in the price of US Oil to be higher without a fight. The price of Oil is now trading at two-week lows after a week of sideways price action due to the uncertainty of the OPEC outcome and Dollar direction post-Jackson Hole.
Given that the majority of rhetoric at Jackson Hole was net USD Bullish, the Oil market will need to see increasing demand in real figures that was projected by the IEA if there are any hopes for a sustained move to and through $50/bbl.
Contrarian System Losing Favor of Upside Risk as of 8/30/16
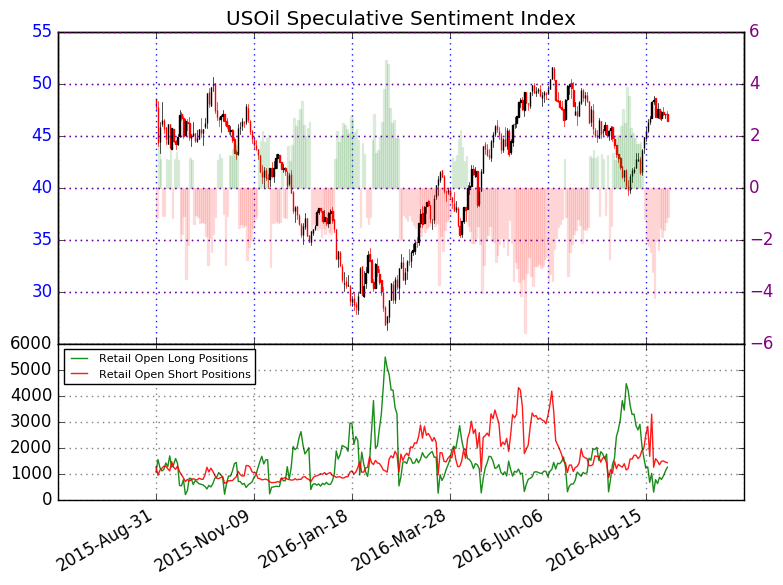
In addition to the technical focus, we should keep an eye on retail sentiment. The upside is beginning to align with our Speculative Sentiment Index or SSI for now.
As of mid-day Friday, The ratio of long to short positions in the USOil stands at -1.14, as 47% of traders are long. Yesterday the ratio was -1.32; 43% of open positions were long. Long positions are 14.6% higher than yesterday and 64.2% above levels seen last week. Short positions are 1.4% lower than yesterday and 4.1% below levels seen last week. Open interest is 5.5% higher than yesterday and 30.0% below its monthly average.
We use our SSI as a contrarian indicator to price action, and the fact that the majority of traders are short gives signal that the USOil may continue higher. The trading crowd has grown less net-short from yesterday and last week. The combination of current sentiment and recent changes gives a further mixed trading bias.
Key Levels Over the Next 48-hrs of Trading As of Tuesday, August 30, 2016
T.Y.
Think Oil has more room to run? Trade Oil With Low Margin Requirements (non-US Residents only)


