


To receive Tyler’s analysis directly via email, please SIGN UP HERE
Talking Points:
- Crude Oil Technical Strategy: Formidable Resistance As Bull Market Is Entrenched
- Dollar Direction and Oil Demand Continue To Be Key Themes In Oil Rally
- Sentimental Trading System Buy Signal Remains, But Is Cooling Down
Access Our Free Q3 Oil Outlook As Oil's Best Quarter Looks For Confirmation
Tuesday saw the price of WTI Crude Oil turnaround toward August highs on positive news for the industry. Iran is said to be sending positive signals that they may support a joint action by OPEC by limiting production so that demand and supply can even out. In addition to the positive fundamental news, all eyes are on Janet Yellen’s Friday speech that may help investors understand what lays ahead for the US Dollar into year-end. The US Dollar is inversely correlated to the price of US Oil so that a weakening US Dollar would likely benefit the price of WTI Crude Oil even further.
Track short-term Crude Oil price levels and patterns with the GSI indicator!
If the US Dollar weakness continues, it seems like this trend could just be getting started. For more definitive levels, let’s go to the charts.
Crude Oil Price Chart Rises Toward Well Identified Resistance at $49.25/bbl

The chart above has consistently provided a helpful framing price action in WTI Crude Oil. After failing at the top channel in June, the price quickly dropped down to a pre-identified zone provided by the median line and the Fibonacci Retracement levels in focus between $41.85-$35.22/bbl. Given the move in August, which last week registered a Bull Market, the price support that is in focus now is ~$41.27/bbl.
As you can see, the price has moved right back up to formidable resistance that is provided by the Channel Top and the price is now resting at the top of the Ichimoku Cloud. A break above this Andrew’s Pitchfork resistance (Red) could provide real excitement as it would be the first time since summer of 2014 that we’ve seen what looks to be a sustainable bullish break for Crude Oil that could keep the price comfortably above the $50/bbl level for a while.
Before resistance breaks, given the ~17 Months within the price channel (aside from the January/February breakdown,) it’s safer to favor price remaining as opposed to breaking out given the low-volatility environment we find ourselves. However, that would likely need a breakdown in OPEC negotiations and a stronger US Dollar, which currently seem like a remote possibility.
The key support that would deflate the confidence of the 20%+ August trend would be a break below the higher-low of $41.27/bbl from August 11. A breakdown below there could be the first confident sign that price will continue to wallow lower in the falling channel drawn on the chart.
Bottom Line:
The price of US Oil does not seem to be slowing down as it heads toward trend-defining resistance near $49/bbl. Positive signs out of OPEC that may cap production as US production continues to lag may help support prices at higher levels. The potential for potential further US Dollar weakness would likely compound the effects of Iran potentially supporting OPEC action to help the price of Oil surmount and remain above $50/bbl.
Contrarian System Beginning To Favor Upside Risk as of 8/23/16
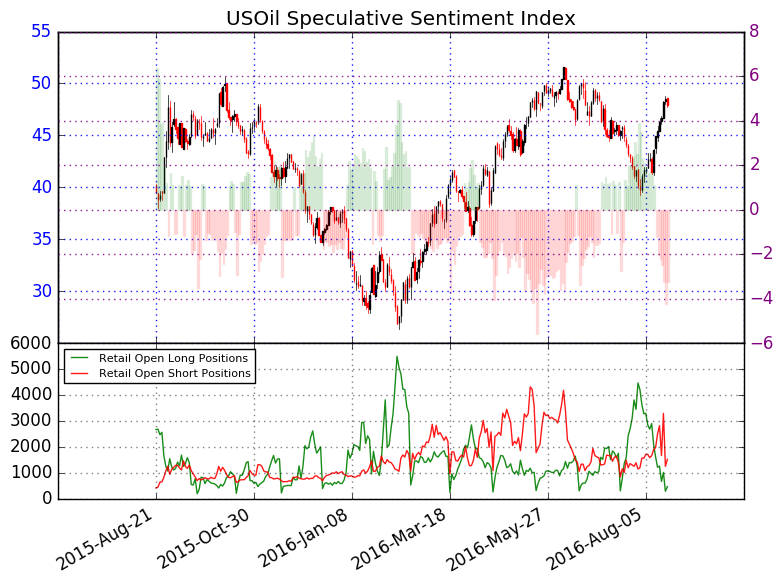
In addition to the technical focus, we should keep an eye on retail sentiment. The upside is beginning to align with our Speculative Sentiment Index or SSI for now.
As of mid-day Tuesday, the ratio of long to short positions in the USOil stands at -3.26, as 23% of traders are long. Yesterday the ratio was -3.16; 24% of open positions were long. Long positions are 53.9% lower than yesterday and 70.8% below levels seen last week. Short positions are 52.5% lower than yesterday and 26.2% below levels seen last week. Open interest is 52.8% lower than yesterday and 54.4% below its monthly average.
We use our SSI as a contrarian indicator to price action, and the fact that the majority of traders are short gives signal that the USOil may continue higher. The trading crowd has grown further net-short from yesterday and last week. The combination of current sentiment and recent changes gives a further bullish trading bias.
Key Levels Over the Next 48-hrs of Trading As of Tuesday, August 23, 2016

T.Y.
Think Oil has more room to run? Trade Oil With Low Margin Requirements (non-US Residents only)


