


To receive Tyler’s analysis directly via email, please SIGN UP HERE
Talking Points:
- Crude Oil Technical Strategy: Favoring Upside > $46.85 (55-DMA)
- Intermarket Analysis Shows US Dollar May Be Public Enemy #1 For Crude Bulls
- Sentimental Trading System Shows Upside Signal Remains Strong
The resiliency of the Bull-Market in WTI Crude Oil (CFD: USOIL) appears to be on trial post-Brexit. So far, it’s showing well as the US Dollar appears to be coming off a strong showing on potential disintegrating rate hike expectations from the Federal Reserve.
A key piece of evidence from the Bull Market’s side for continuation was Wednesday’s inventory data from the DoE. We have seen a trend over the last 6-weeks of draws on the stock of U.S. Crude Oil Inventory. Wednesday’s data print showed an extreme beat of the inventory data with an expectation of -2220k that saw an actual inventory draw surpassed (read: demand) of -4053k.
A key theme since Oil bottomed in mid-February has been a balancing out of the feared supply glut as demand has picked up. As a short-term history lesson of extreme sentiment, there were fears in January that the US would run out of Oil storage because supply had risen so aggressively compared to present demand. Fast-forward to today, and it appears we’re unwinding that negative sentiment still, and if US Dollar breaks lower that upside could have much further to go.
Now, on to the charts.
A Break Above Key Resistance at $51/bbl Opens Up a Run Toward $60/bbl

The 55-Day Moving Average, currently at $46.86/bbl has held as safe support for nearly four months now. After Wednesday's Oil data, the 55-DMA appears to bring a solid support that traders can continuously rely on as a litmus test to validate the uptrend.
As of Wednesday, the price of USOil is approaching a key lower high at $50.51/bbl. If we break above this point of resistance, we will likely be aiming towards new 11-month highs that currently sits at $51.64/bbl.
In addition to the current June high of $51.64/bbl, there was a lot of resistance in the $51/bbl region such as the 100% Fibonacci extension move off the February low and the October 2015 higher. Therefore, to see a pullback is not surprising.
Furthermore, if we break above the ~$51 resistance level, a stronger break toward the next key resistance level ~$60 could be underway.
Contrarian System Warns of Further Upside As of 6/29/16

In addition to the technical focus around multiple support-zones, we should keep an eye on retail sentiment, which favors more upside price action. Further upside is currently aligned with our Speculative Sentiment Index or SSI for now.
The ratio of long to short positions in the USOil stands at -1.43, as 41% of traders are long. Short positions are 24.0% higher than yesterday and 30.2% above levels seen last week. Open interest is 13.1% higher than yesterday and 10.6% below its monthly average.
We use our SSI as a contrarian indicator to price action, and the fact that the majority of traders are short gives a signal that the USOil may continue higher. The trading crowd has grown further net-short from yesterday but moderated since last week.
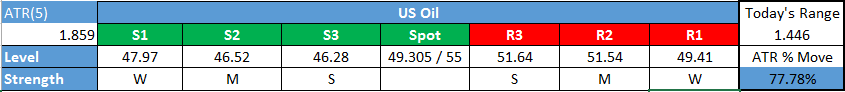
Key Levels Over the Next 48-hrs As of Wednesday, June 29, 2016
T.Y.


