


To receive Tyler’s analysis directly via email, please SIGN UP HERE
Talking Points:
- Crude Oil Technical Strategy: Strength In Doubt, Upside Still Favored As We Sit Above Major Moving Averages
- Is a Strong Dollar Going to Help Carve a Top in Oil Prices?
- Sentimental Trading System Shows Upside Bias Waning
The month of May doesn’t appear to be providing the bullish support for WTI Crude Oil that prior months have. At least, this hasn’t played out within first weeks of trading in May. A strong US Dollar and weak global risk sentiment picture have caused concerns that the imbalance from supply, albeit contracting over-supply, and demand will remain unreasonably wide favoring lower price.
Over the weekend, we saw two key developments that have led to a weak opening for WTI Crude Oil to open the week. First, and foremost, Chinese trade data disappointed and a continued fear of China’s debt and inability to help nurture further growth alongside the removal of Saudi Arabia’s Oil Minister of 20-years, Ali Al-Naimi as the country looks to diversify away from the price of Oil to drive a sovereign surplus.
Compete to Win Cash Prizes With Your FXCM Mini Account, Click Here For More Info
With the Saudi & Chinese development, many may be wondering why we see saw the bid in US Oil to open the week. The key reason for the bid amidst the weak data is the continuation of wildfires in Canada continuing to hurt the output. As we head into Mid-May, Friday’s weaker- than-expected U.S. employment data shows the market pricing has driven the probability of a Fed June rate-hike probability now below 10%. This lack of expected Fed Action affects the US Dollar, which influences the direction of the WTI Crude Oil price.
Price Appears to Be Ranging Between $43/bbl-$46/bbl
To See How FXCM’s Live Clients Are Positioned In FX & Equities Click Here Now.
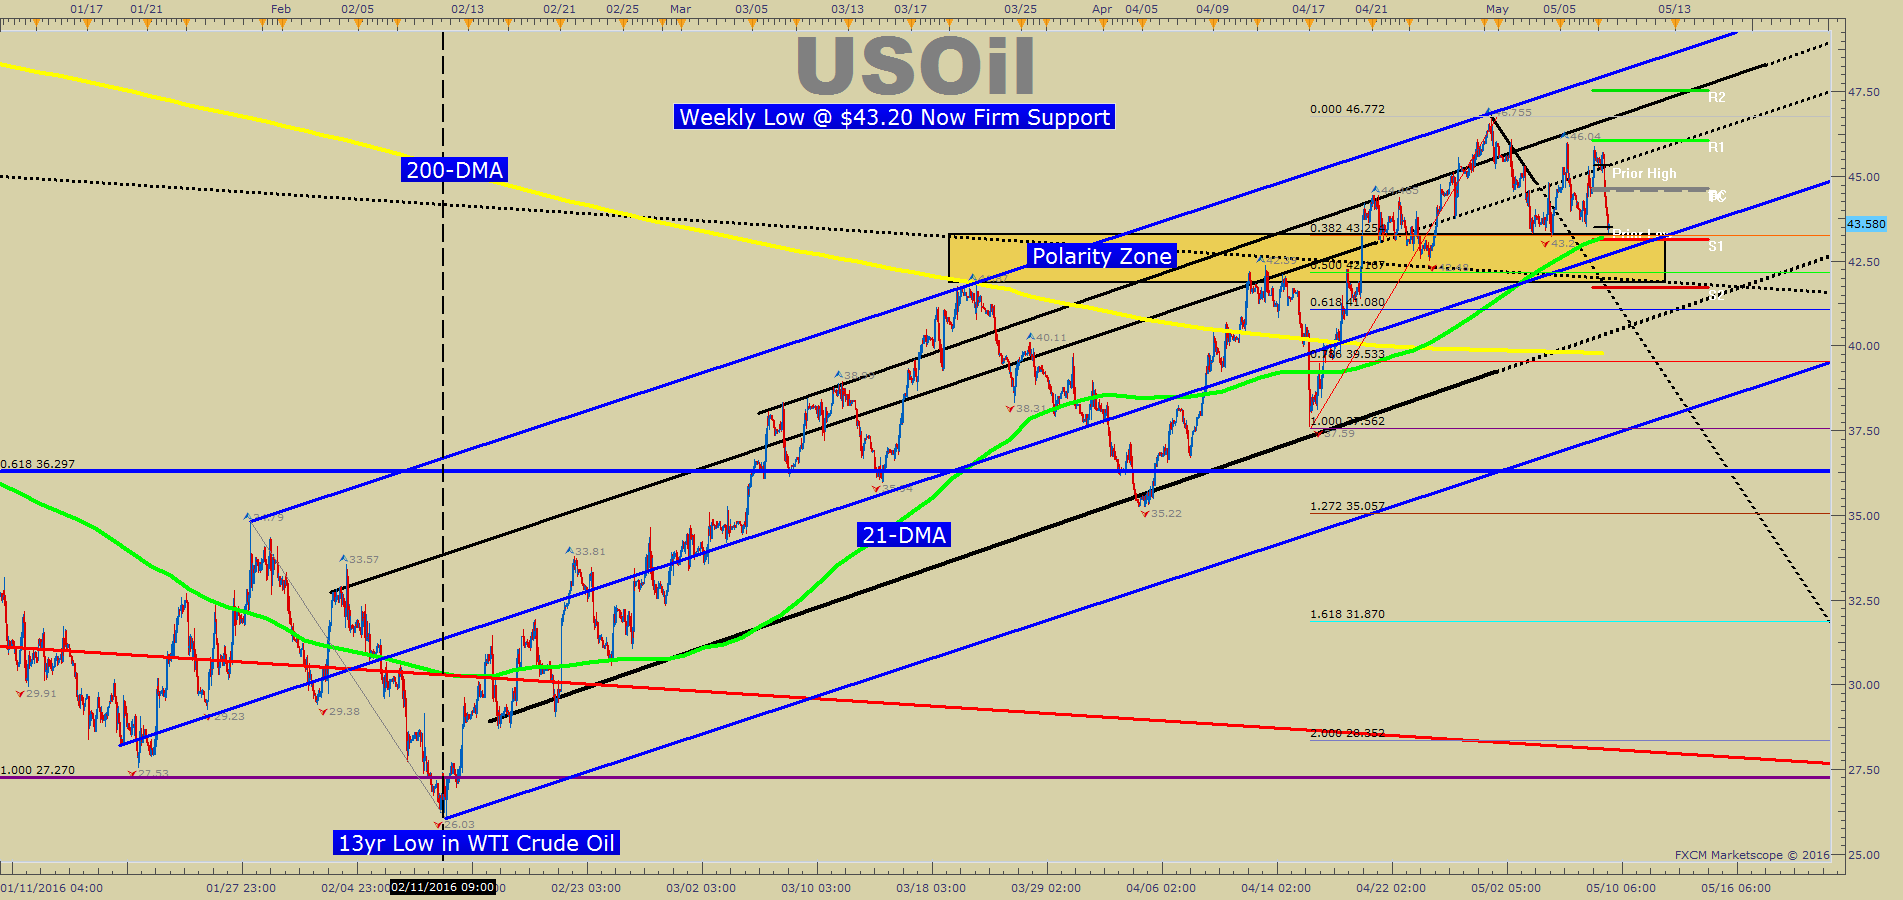
The above chart is a medium-term price channel via Andrew’s Pitchfork tool with sliding parallels drawn with the slope of the median line off of key pivots. The lower handle is drawn off the February 11 low at 26.03. You’ll notice on the bottom-left of the chart; the sliding parallels have acted as key pivot support zones into Q2. Now that we have seen a break above the 200-DMA (currently near $40/bbl), our focus turns higher to the upper parallel line around $47.50.
Key Support & Resistance Levels from Here (Visual Map Below)
The Support Zone in focus in the middle of a few volatile sessions is the Wednesday low of last week and the 21-DMA (green) at $43.20. The weekly R1 pivot, which often plays a good role of Bull Market swing support, is at $43.17, and that is followed by the 38.2% retracement of the mid-to-late-April range at $43.25.
Below this cluster of support at $43.30, the Weekly S2 comes in near $41.75. In a healthy bull market, which doubts are creeping in if this would qualify, there could be a quick drop to the 200-DMA, which would take a strong move lower toward ~$40/bbl. Given the significance of the Intermarket factors that have shifted since Oil broke above $40/ 200-DMA, only a move below there would change my bullish model.
The obvious resistance, for now, appears to be $46 regarding intraday resistance and $45/bbl on a closing basis. After Crude Oil printed a 2016 high of $46.75, the market has failed to close above $45/bbl even though we’ve seen multiple daily moves above there. An inability to close above $45 shows us that either a stronger move down is at work, or at least a sideways correction is in the works.
Due to the macro environment, I’m staying bullish for now, and the April high is the next resistance level in focus at $46.75/bl. Beyond there, the Weekly R2 pivot at $47.55 may soon be tested. However, this all assumes the US Dollar doesn’t follow suit of May 2015.
Contrarian System Warns of Further Upside
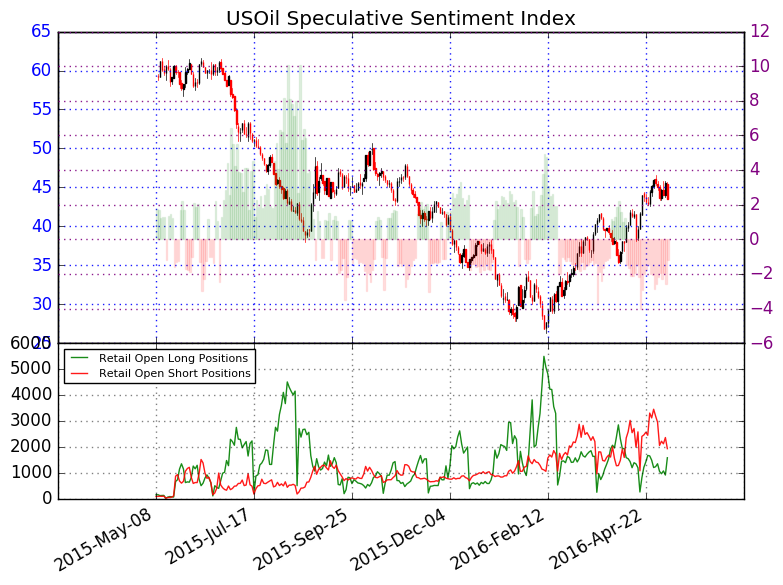
In addition to the technical focus around Andrew’s Pitchfork, the Fibonacci 38.2% retracement, and the moving averages, we should keep an eye on retail sentiment, which could be warning of more upside price action. Further upside is aligned with our Speculative Sentiment Index or SSI for now.
According to client positions at FXCM, the ratio of long to short positions in the US Oil stands at -1.23 as 45% of traders are long. Yesterday the ratio was -2.20; 31% of open positions were long. Long positions are 57.5% higher than yesterday and 13.6% above levels seen last week. Short positions are 11.8% lower than yesterday and 36.1% below levels seen last week.We use our SSI as a contrarian indicator to price action, and the fact that the majority of traders are short gives signal that the USOil may continue higher. If the trading crowd grows further net-short, we could be in the works of an upside extension while respecting the key support around $43/bbl.
Key Levels Over the Next 48-hrs As of Monday, May 9, 2016

T.Y.
Think Oil has more room to run? Trade Oil With Low Margin Requirements (non-US Residents only)


