


Interested In our Analyst’s Longer-Term Oil Outlook, be sure to sign up for our free oil guide here.
Talking Points:
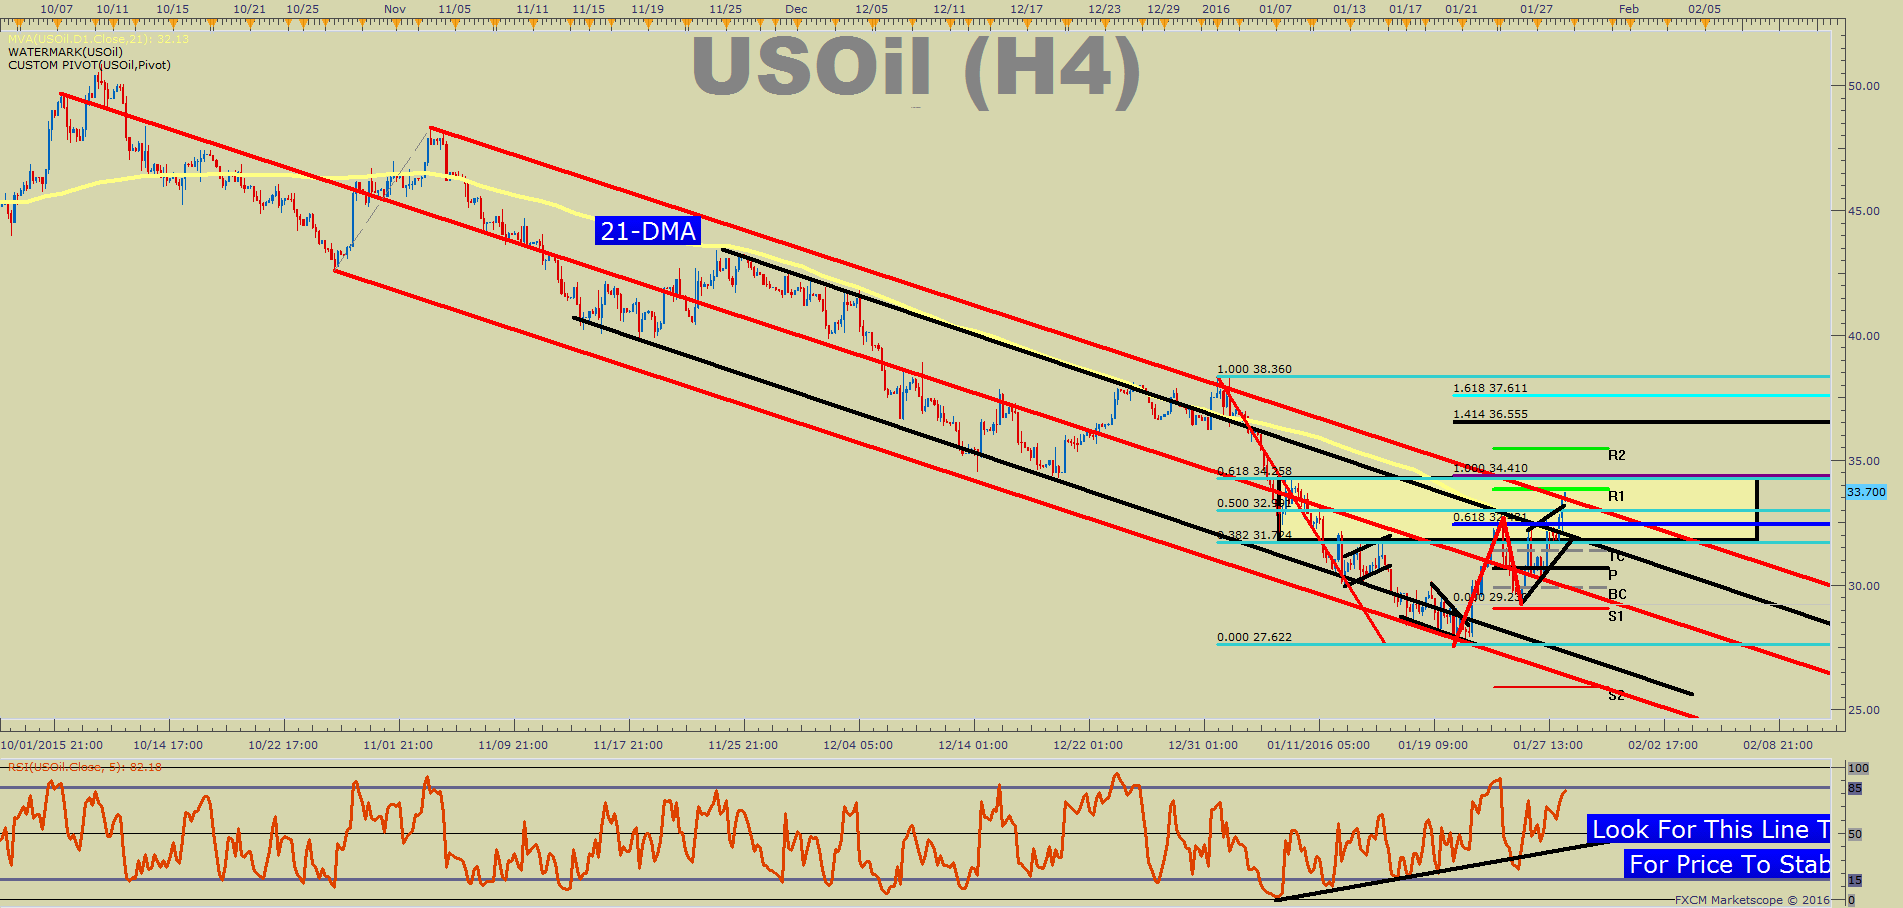
- Crude Oil Technical Strategy: Oil Moving into Key Resistance Zone at $34.25-$38.36/Bbl
- Unwind Of Large Bearish Trade by Hedge Funds Continue To Bring Volatility
- WTI Continues To Lead Risk Sentiment, Watch for Rally in Equities to Follow If Rebound Resumes
Was That The Bottom?
What a difference a week can make. In the middle of last week, there were stories about sour crude in North Dakota going for less than nothing does, in other words, producers were paying other people to take their production of their hands. When I was growing up in West Texas in the early 1980s, there was a common bumper sticker that said, “Please God, give me one more oil boom. This time, I promise not to piss it away.” Slowly, but surely, after the bottom hit, prices started rising naturally again.
However, the larger factors that have been a constant pressure are still present and accounted for in this large 25%+ bounce. First , the US Dollar continues to be sitting near 12.5-year highs, and yesterday’s FOMC shows a forward-looking Fed could still be looking to hike rates throughout this year. Secondly, Oil production cuts appear needed more now than ever. The EIA noted yesterday that the global stock of Oil was at the highest levels since 1930.
There Is Nothing New Under the Sun, Including (Especially) in Markets
Oddly enough, in 1930, a cartel of the world’s largest Oil companies at the time had to come together to broadly cut production to reverse the flood of market supply that was fueled by new discoveries and worries that the world would run out of Oil in the 1920s. Today, Russia & OPEC have been whispered to cut production, but a promise from Oil producers to cut production, which is how many are servicing the short-term liabilities every producer faces, appear elusive. The headline that preceded the NY Open surge was as follows:
"OPEC, OTHER PRODUCERS TO MEET IN FEB. ON MINISTER LEVEL: RIA RUSSIAN ENERGY MINISTER NOVAK SAYS SAUDI ARABIA PROPOSED TO CUT OIL PRODUCTION BY EACH COUNTRY BY UP TO 5 PCT"
Naturally, if the resolution of the supply glut may not come anytime soon, the solution would then be found in a jump in demand. Demand currently is not looking to hot right now, unfortunately. The demand as stated by the EIA is tracking lower in the United States by 2% on a year on year basis. In addition, Chinese demand seems to be dropping as well. In other words, while this move higher is impressive, the demand dynamics makes the need for a system-wide production cut even more necessary, and without such a cut, it will be difficult to call the January 20 low, the bottom.
Trade Oil with no re-quotes, learn more HERE (non-US residents only)
Key Levels from Here
Last note, we shared that focus on the charts should be based on the 2016 opening range high of 38.36. Given today’s sharp move higher, another key level, which is taken from the 38.2 Fibonacci retracement levels of the November-January range is at 35.50. Therefore, the burden of proof that a bottom has been put in is on the bulls given the very sharp drop in unsustainable production prices causing more aggressive producing. If price can make it through 35.50-38.36 zone, a strong argument can be made on the technical side that this late January move was more than a ‘dead cat bounce.’
Sentiment Flip Warns of Further Short-Term Upside
Oil still has a lot of pressure on its back, and may continue to fall even lower, which aligns with our Speculative Sentiment Index or SSI. Our internal readings of Oil are showing an SSI reading of -1.6114. We use our SSI as a contrarian indicator to price action, and the fact that the majority of traders are bearish provides a signal that US Oil may continue higher. If the reading were to turn positive again, and price broke back below $30bbl, we could begin looking for a retest of the YTD low of $27.53.
Sentiment extremes look to be the likely reason for the aggressive rally and recent volatility starting late last week as Oil bears took their profitable trades off the table. Looking at the CFTC Commitment of Traders report, hedge funds cut their bearish bets on oil ahead of the rally; with speculators' short position, shrinking 8.4 percent in the week ended January 19, and likely continued to do so as the price moved higher. An estimated report showed that short positions had doubled to a record 200 million bbls over the past three months, which are likely being closed out through this aggressive move higher.
T.Y.
To receive Tyler’s analysis directly via email, please SIGN UP HERE


