


Japanese Yen Technical Price Outlook: Near-term Trade Levels
- Japanese Yen technical trade levels update – Daily & 120min Charts
- USD/JPY testing key support- bears at risk above 105.20 near-term
- Resistance into 106 – break lower exposes 104.12
The Japanese Yen is vulnerable after a three-day offensive against the US Dollar with USD/JPY now testing key near-term support. A recovery off this mark may offer more favorable opportunities in the days ahead as price continues to trade within a well-defined technical formation. These are the updated targets and invalidation levels that matter on the USD/JPY technical price charts. Review my latest Weekly Strategy Webinar for an in-depth breakdown of this Yen trade setup and more.
Japanese Yen Price Chart – USD/JPY Daily
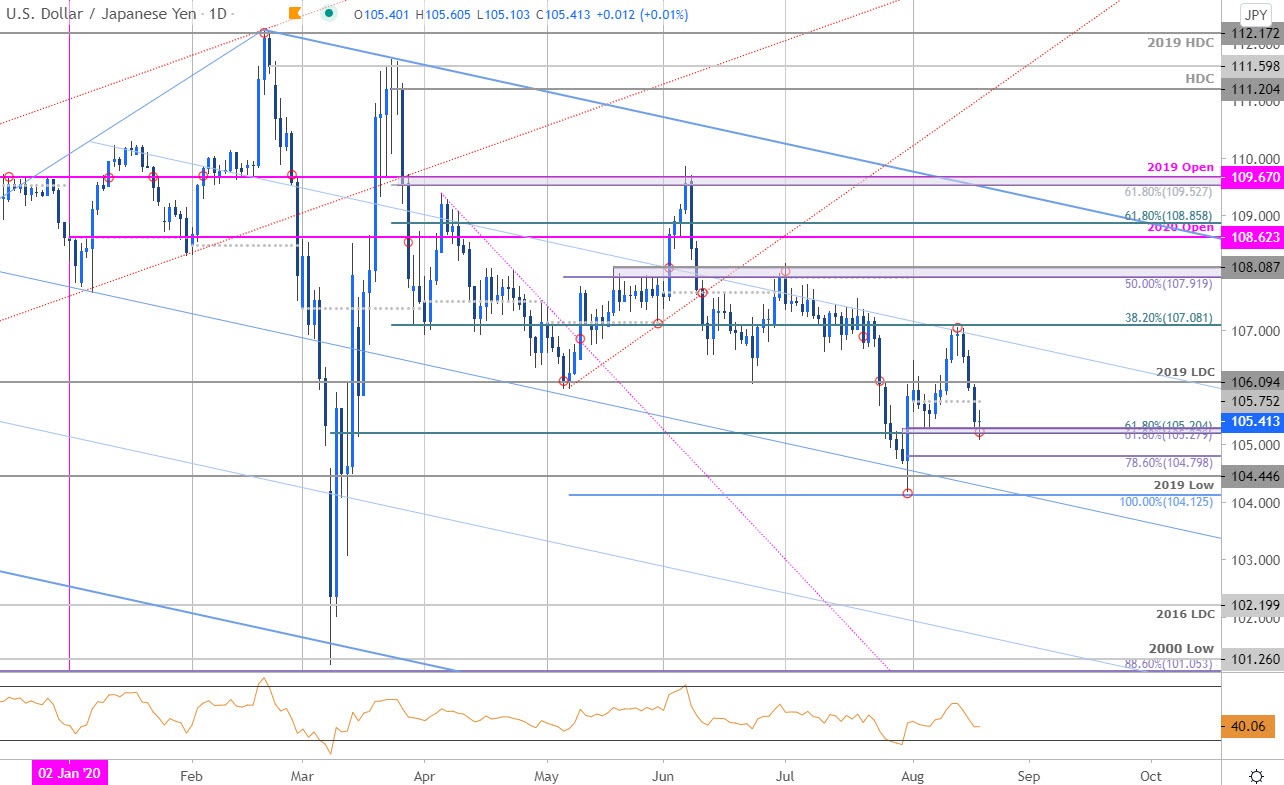
Chart Prepared by Michael Boutros, Technical Strategist; USD/JPY on Tradingview
Technical Outlook: In my last Japanese Yen Price Outlook we noted that USD/JPY was approaching a downtrend resistance and to, “be on the lookout for possible topside exhaustion ahead of 107.58,” IF price was indeed heading lower. USD/JPY registered a high at 107.05 late-last week before turning sharply lower with a three-day sell-off taking price back into the August opening-range lows / confluence Fibonacci support at 105.20/29.
Monthly open resistance stands at 105.75 backed by the 2019 low-day close / May & June lows around ~106.10 – the risk remains weighted to the downside while below this threshold with a breach above the 38.2% retracement / monthly range highs at 107.08 ultimately needed to shift the focus back to the long-side.
Japanese Yen Price Chart – USD/JPY 120min

Notes: A closer look a Yen price action shows USD/JPY trading within the confines of an descending pitchfork formation extending April / June highs with an embedded channel guiding the most recent decline. A break below this key support barrier is needed to mark resumption with such scenario exposing the 78.6% retracement at 104.80 backed by the 2019 low at 104.44 and the 100% extension tat 104.13.

For a complete breakdown of Michael’s trading strategy, review his Foundations of Technical Analysis series on Building a Trading Strategy
Bottom line: USD/JPY is testing key support at the monthly range-lows and we’re looking for a reaction here. From a trading standpoint, a good region to reduce short-exposure / lower protective stops – be on the lookout for possible topside exhaustion ahead of the weekly open on a recovery IF price is heading lower. Review my latest Japanese Yen Weekly Price Outlook for a closer look at the longer-term USD/JPY technical trade levels.
Japanese Yen Trader Sentiment – USD/JPY Price Chart
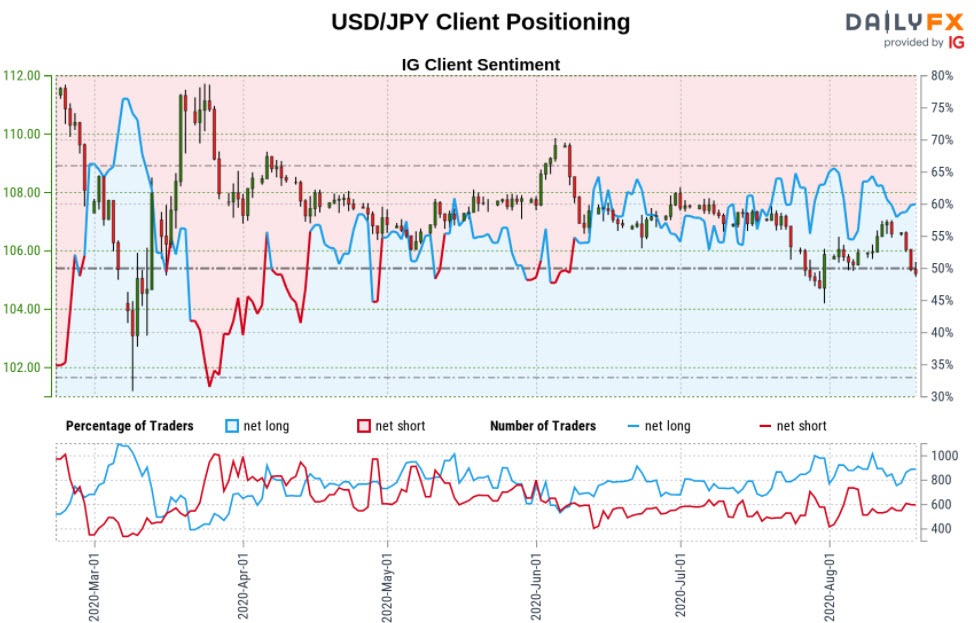
- A summary of IG Client Sentiment shows traders are net-long USD/JPY - the ratio stands at +1.13 (53.13% of traders are long) – neutral reading
- Long positions are9.88% lower than yesterday and 5.19% higher from last week
- Short positions are 23.85% higher than yesterday and 1.58% higher from last week
- We typically take a contrarian view to crowd sentiment, and the fact traders are net-long suggests USD/JPY prices may continue to fall. Yet traders are less net-long than yesterday but more net-long from last week and the combination of current positioning and recent changes gives us a further mixed USD/JPY trading bias from a sentiment standpoint.
| Change in | Longs | Shorts | OI |
| Daily | 7% | 0% | 1% |
| Weekly | -2% | 1% | 0% |
---
Key US / Japanese Data Releases
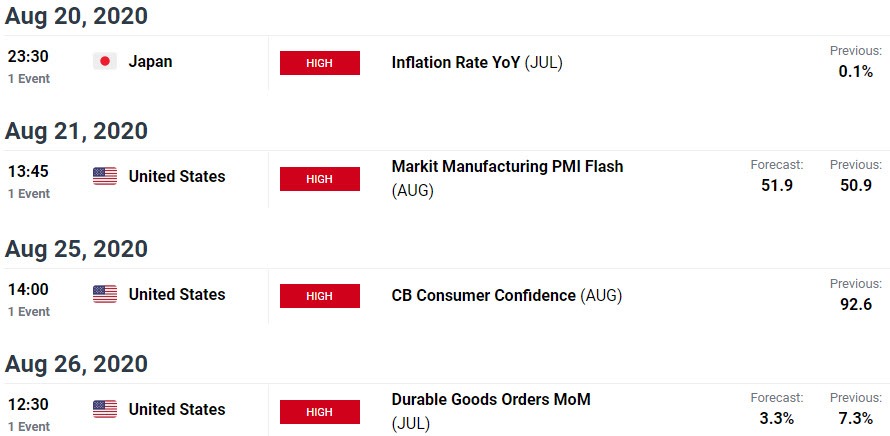
Economic Calendar - latest economic developments and upcoming event risk.
Active Trade Setups
- Australian Dollar Forecast: AUD/USD Seven-Week Rally at Risk
- Canadian Dollar Outlook: USD/CAD Five Weeks Down, Five Month Low
- Gold Price Outlook: XAU/USD Crashes – Reversal or Retracement?
- Dollar vs Mexican Peso Price Outlook: USD/MXN Range Breakout Imminent
- Euro Dollar Outlook: EUR/USD Breakout Faces Key Fibonacci Resistance

--- Written by Michael Boutros, Technical Currency Strategist with DailyFX
Follow Michael on Twitter @MBForex


