


JAPANESE YEN FORECAST: JPY PRICE ACTION FLIRTS WITH 8-MONTH LOWS AS RISK APPETITE FLOURISHES
- The Japanese Yen has succumbed to a flood of risk appetite spurred largely by US-China trade deal optimism which pushed JPY price action nearly 5% lower over the last 5-months
- USD/JPY, EUR/JPY, GBP/JPY, AUD/JPY and CAD/JPY implied volatility readings are hovering around multi-year lows as market sentiment grows increasingly upbeat
- A return of volatility in response to the next influx of uncertainty or systemically destabilizing event could bolster the Japanese Yen and send JPY prices snapping back higher
The Japanese Yen has plunged roughly 4.5% since printing its recent swing high this past August. Weaker JPY prices can be explained largely by the rebound in market sentiment driven broadly by US-China trade deal optimism with Washington and Beijing set to ink a partial trade agreement later this week.
This is due primarily to the Japanese Yen’s anti-risk characteristics and popular use to fund the currency carry trade. As such, JPY price action tends to benefit during episodes of risk aversion and periods of turbulence – or volatility. On the contrary, the Japanese Yen tends to experience downward pressure when appetite for risk proliferates and measures of currency volatility are low.
JAPANESE YEN CURRENCY INDEX PRICE CHART: DAILY TIME FRAME (DECEMBER 2018 TO JANUARY 2020)

Chart created by @RichDvorakFX with TradingView
This concept is illustrated in the chart above, which highlights the generally strong positive correlation between JXY (Japanese Yen Currency Index) and JYVIX (Cboe’s 30-day implied volatility index on the JPY). In turn, lower readings of implied volatility typically act as a headwind to JPY price action.
Expected activity in the Japanese Yen has swooned as of late with the apparent improvement in trade relations between the US and China – the two largest economies in the world – fueling a rebound in global GDP growth expectations. FX volatility has also been pressured lower by the series of dovish action revealed by major central banks last year, which have kept financial conditions accommodative.
JAPANESE YEN IMPLIED VOLATILITY (3-MONTH): USD/JPY, EUR/JPY, GBP/JPY, AUD/JPY & CAD/JPY
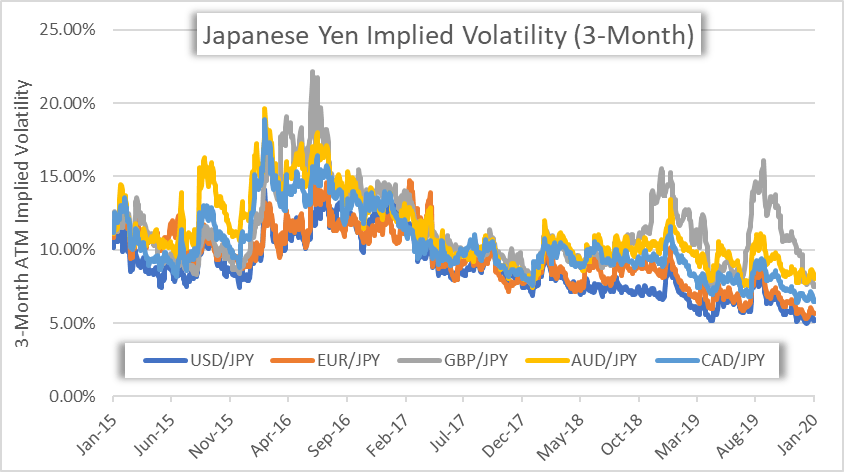
In fact, the recent string of upbeat market sentiment has sent various measures of Japanese Yen implied volatility down to their lowest levels on record. On that note, USD/JPY implied volatility over the next 3-months was just clocked at a record low 5.1% with the metric’s latest nosedive being mirrored closely by the respective 3-month implied volatility readings for EUR/JPY, GBP/JPY, AUD/JPY and CAD/JPY as well.
| Change in | Longs | Shorts | OI |
| Daily | -16% | -3% | -5% |
| Weekly | 4% | 7% | 6% |
As such, spot USD/JPY, EUR/JPY, GBP/JPY, AUD/JPY and CAD/JPY prices could continue churning higher as the Japanese Yen remains bogged down until forex traders witness a sustained rise in volatility and accompanying deterioration in risk appetite. Likewise, Japanese Yen risk reversal readings suggest that JPY prices may remain under pressure against other major currency pairs.
JAPANESE YEN RISK REVERSALS (3-MONTH): USD/JPY, EUR/JPY, GBP/JPY, AUD/JPY & CAD/JPY
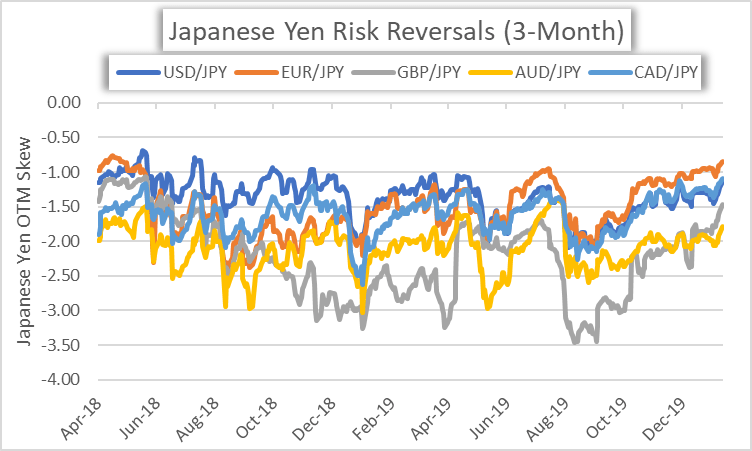
Specifically, the 3-month risk reversal readings for USD/JPY, EUR/JPY, GBP/JPY, AUD/JPY and CAD/JPY have climbed steadily since September 2019, which is roughly when the JXY Japanese Yen Currency Index peaked last year. A risk reversal reading above zero indicates that the demand for call option volatility (upside protection) exceeds that of put option volatility (downside protection).
USD/JPY PRICE CHART: WEEKLY TIME FRAME (MAY 2015 TO JANUARY 2020)
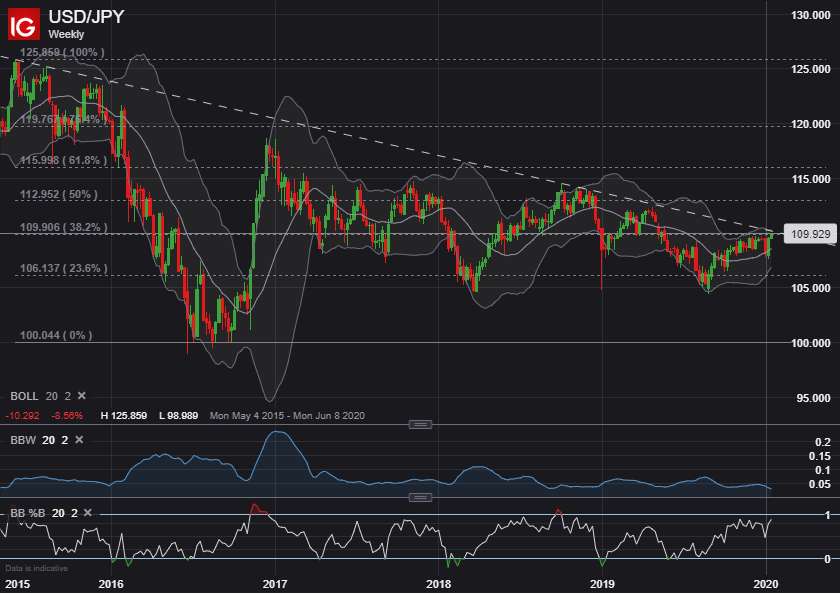
Shifting gears to a weekly spot USD/JPY price chart brings to light the currency pair’s overarching downtrend since its June 2015 peak. This technical barrier around the 110.00 level – also underpinned by the 38.2% Fibonacci retracement of its year-long slide from June 2015 to June 2016 as well as the upper channel of its 2-standard deviation Bollinger Band – possesses potential of hindering further upside in spot USD/JPY.

A rejection at this major zone of technical resistance could send spot USD/JPY prices pivoting lower in an abrupt fashion as the US Dollar hits an 8-month high against the Japanese Yen. However, topping this level could open up the door for Japanese Yen bears to target the 112.00 price level before confluent resistance posed by the 114.00 mark comes into focus.
-- Written by Rich Dvorak, Junior Analyst for DailyFX.com
Connect with @RichDvorakFX on Twitter for real-time market insight


