


JAPANESE YEN TECHNICAL ANALYSIS TALKING POINTS:
- The Japanese Yen remains cowed by the US Dollar
- USD/JPY’s uptrend channel looks very secure
- However bulls may soon need to take stock
Get live and interactive coverage of all major Japanese economic data at the DailyFX Webinars. We’d love to have you join us.
The Japanese Yen is still getting crushed by the US Dollar, with USD/JPY now up to highs we hadn’t seen this year since mid-January.
There is a sound-enough fundamental reason for this. The US Federal Reserve remain on its path of gradual monetary tightening, as underlines by Chair Jerome Powell’s Congressional testimony this week. The Bank of Japan meanwhile is stuck with extremely low inflation and, in consequence, ultra-loose monetary policy.
So much for the fundamentals.
Technically speaking USD/JPY is now bumping up against a band of probably significant resistance which marks this year’s highs, made back in January.
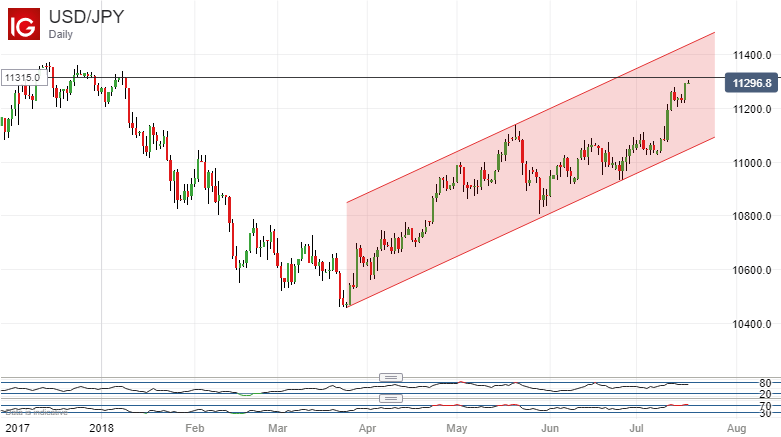
Dollar bulls have control, it seems, and probably stand a good chance of getting the pair back into that range at least. However the rise up from the last test of the current dominant uptrend channel base has been rather steep.
The Dollar bounced there at 110.29 on July 9 and has risen nearly three full Yen in the short period since. Although momentum indicators don’t look stretched, and the moving averages don’t suggest an imminent reversal, this looks like a pair which could do with some consolidation.
If it comes. it may bring trade back to the 111.10 area which would mark the first, 23.6% Fiboancci retracement of the rise up from the lows of late March. Provided that any falls below that are contained the Dollar bulls will still have reason to hope.
If on the other hand they can get back to the mid 113’s which we last saw at the start of this year, then the highs of November 2017 will come into focus. They come in at 114.50 and mark peaks above which progress has been elusive since March of that year.
USD/JPY strength has unsurprisingly translated into some general Yen weakness on the crosses, with even Brexit-beset Sterling joining in. GBP/JPY’s recent rise has taken it above its previous significant peaks in the 148.03 area. However, it has yet to fully retrace the sharp fall seen between mid and late May this year. To do that it would need to get back above 150, and that looks like a very tall order for a rise which already seems to be fading.
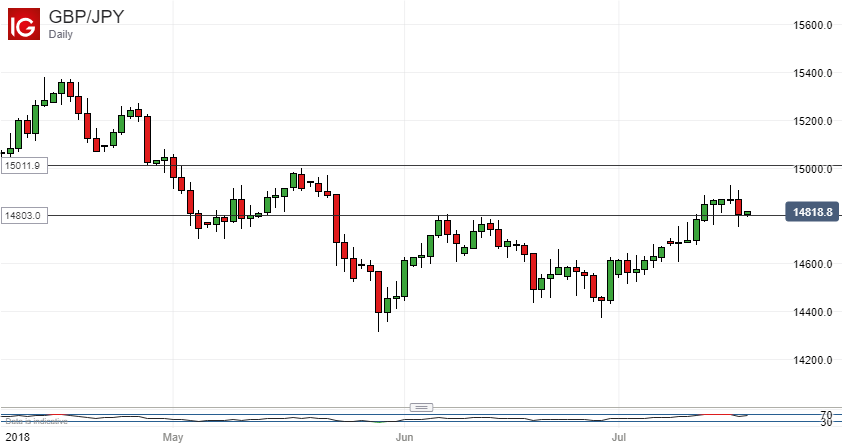
The Pound may find support at previous resistance in the 148 region, but June’s lows at 143 could beckon if that gives way.
RESOURCES FOR TRADERS
Whether you’re new to trading or an old hand DailyFX has plenty of resources to help you. There’s our trading sentiment indicator which shows you live how IG clients are positioned right now. We also hold educational and analytical webinars and offer trading guides, with one specifically aimed at those new to foreign exchange markets. There’s also a Bitcoin guide. Be sure to make the most of them all. They were written by our seasoned trading experts and they’re all free.
--- Written by David Cottle, DailyFX Research
Follow David on Twitter @DavidCottleFX or use the Comments section below to get in touch!


