


Will Yields Continue To Drive JPY in 2Q? See our forecast to find out what’s driving the biggest market trends!
Talking Points:
- USD/JPY Technical Strategy: Short, still favoring test of 200-DMA at 108.47
- JPY Strongest G10 Currency Trading At 2017 Highs
- Previous Post: JPY Remains Quietly Strong As French Election Risk Remains
JPY has long been the strongest currency in G10 due to the few other currencies having persistent strength. The weakest currency has shifted from different commodity currencies recently. However, we continue to see JPY strength aligning with the recent drop in Yields to 2017 lows with the UST 10Yr Yield trading below a yield of 2.30.
Many traders are rightfully focused on persistent closes below 110 as proof of strength likely persisting in JPY. The focus on the chart should we see multiple closes below 110 is the 200-DMA at 108.53 followed by the 100% ABC extension from the Mar 13 high of 115.504.
The appropriate price level that should USD/JPY trade about that could indicate USD strength or subsequent JPY weakness is the April 5 low of 110.54 followed by the April 4/ 11 high of 110.92. The absence of a close above 110.92 alongside the sentiment picture explained below remaining in its current state since January 9 will keep the bias bearish.
Interested in Joining Our Analysts, Instructors, or Strategists For a Free Webinar? Register Here

Chart Created by Tyler Yell, CMT
What do retail traders’ buy/sell decisions hint about the JPY trend? Find out here !
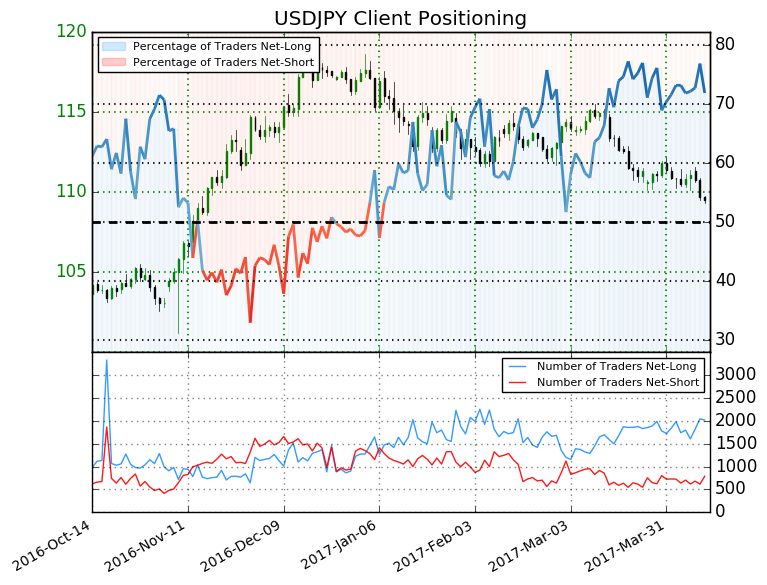
USDJPY: Retail trader data shows 71.9% of traders are net-long with the ratio of traders long to short at 2.56 to 1. In fact, traders have remained net-long since Jan 09 when USDJPY traded near 117.189; price has moved 6.5% lower since then. The number of traders net-long is 5.8% higher than yesterday and 0.9% higher from last week, while the number of traders net-short is 5.8% higher than yesterday and 2.4% lower from last week.
We typically take a contrarian view to crowd sentiment, and the fact traders are net-long suggests USDJPY prices may continue to fall. Traders are further net-long than yesterday and last week, and the combination of current sentiment and recent changes gives us a stronger USDJPY-bearish contrarian trading bias. (Emphasis Mine)
---
Shorter-Term USD/JPY Technical Levels: Wednesday, April12, 2017
For those interested in shorter-term levels of focus than the ones above, these levels signal important potential pivot levels over the next 48-hours.

Contact and discuss markets with Tyler on Twitter: @ForexYell


