


Talking Points:
- USJ/JPY Technical Strategy: Consistent Pressure Favors Potential Break
- The JPY Ends The Week Quietly As The Strongest G8 Currency
- Data Next Week May Put Further Pressure on 100
Access Our Free Q3 JPY Outlook As Pressures Mount on BoJ & the Federal Reserve Here
USD/JPY Fails To Bounce On Key Level
USD/JPY fell back below 101.00 as the US Dollar softened on a weak Retail Sales number ex-autos early Friday. While the late July BoJ meeting disappointed JPY Bears, there appears to be a consistent pressure on low-yielding currencies like the US Dollar, Euro, and British Pound.
Previously, we have mentioned the importance of the 200-WMA that has provided appropriate directional biases since 2008. The current level of the 200-WMA sits near ~¥107 per Dollar. As you can see in the chart below, there is a lot of resistance above the price of USD/JPY in addition to the 200-WMA that should put caution to USD/JPY value buyers.
As of August 12, the JPY has strengthened by nearly ~16% YTD vs. the USD. An additional narrative that is failing to take hold is a possible rate hike in the coming 12-months from the Federal Reserve. The lack of a Fed-Driven stronger Dollar removes half of the recipe for USD/JPY to push higher and further argues for staying with the downtrend.
Find The Habits That Emerged From Successful Traders When We Studied 10’s of Millions Real Trades
USD/JPY Continues Below Heavy Resistance on Unrelenting JPY Strength
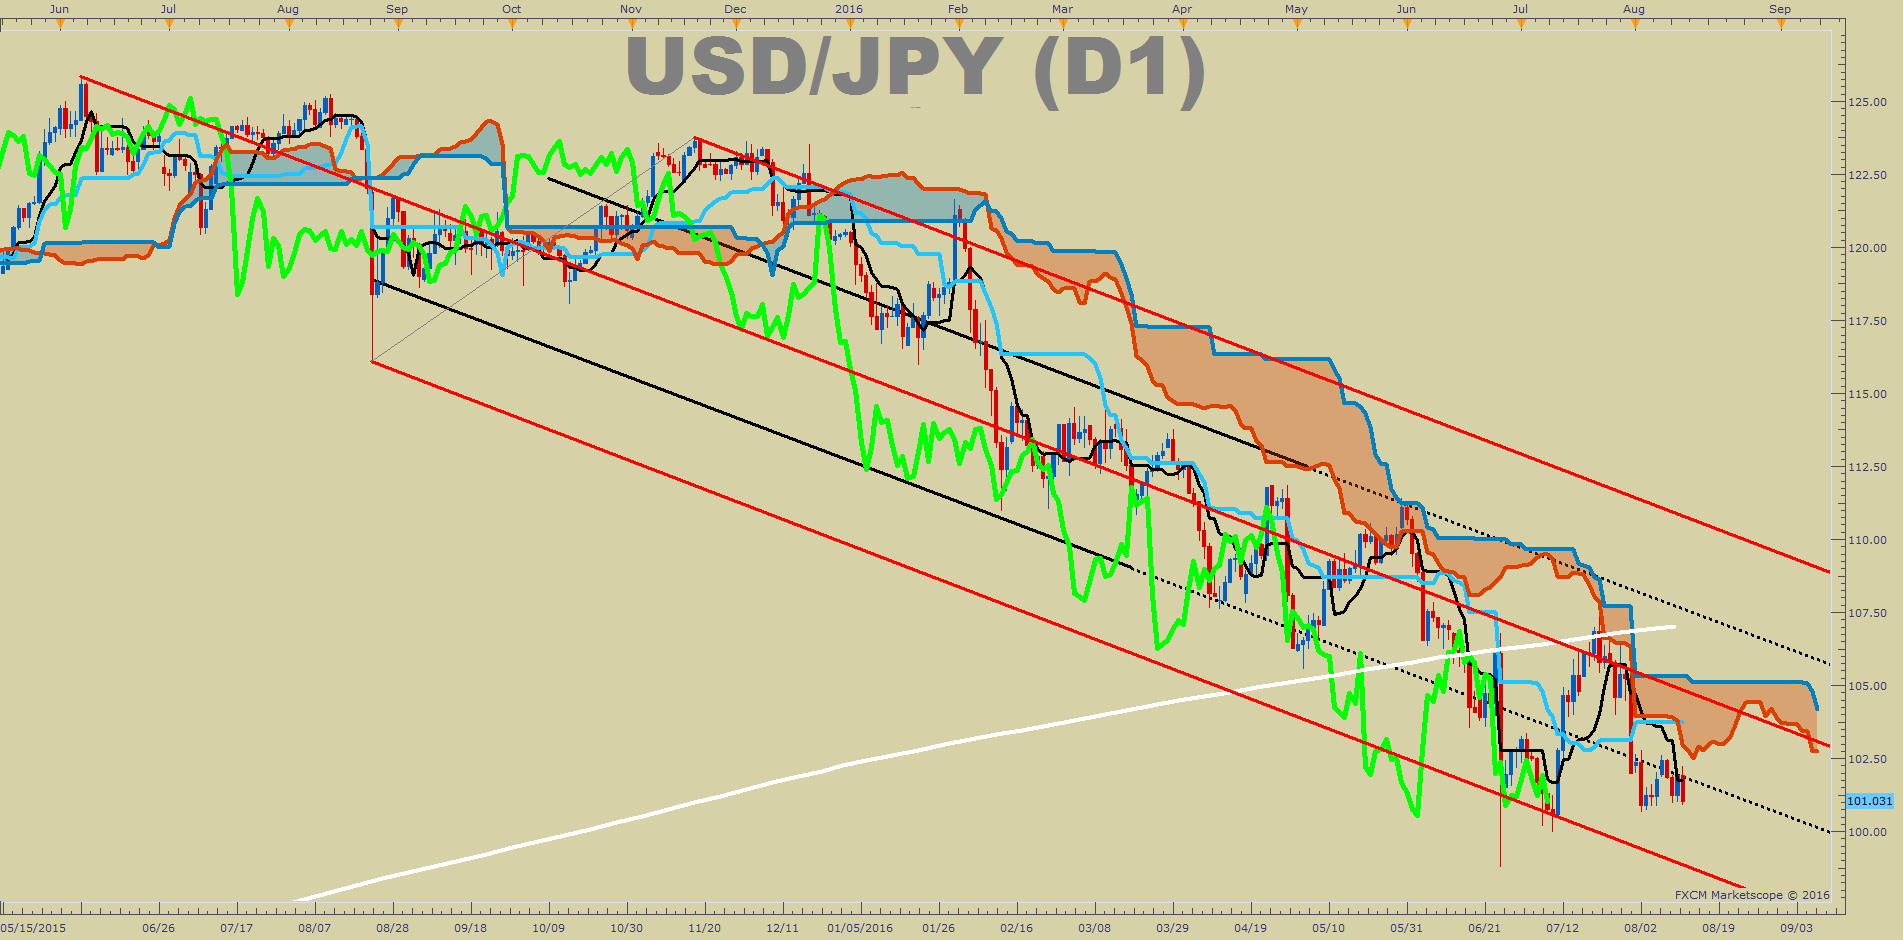
Looking above, you can see what appears to be a very clear downtrend alongside a 200-WMA (currently at 107.04). The chart above does not show the long-term significance of the 200-WMA, but the break below favors further downside. Only a sustained break above the 200-WMA would tilt the bias for JPY Selling.
You will also notice that Andrew’s Pitchfork (Red) and the Ichimoku Cloud bring further clarity to prefer the downside continuation. What has surprised many is that the low-volatility and high equity environment has failed to put pressure on the JPY. The lack of JPY weakness shows that selling JPY as part of the traditional Carry Trade is dying down.
The Technical Picture
The Bearish Price Channel (Red) is drawn from the June 2015 High, the August 24 low and the November high. This channel has contained the price rather well, and until there is a sustained break above the channel median-line (104.75), which is roughly the top of the Ichimoku Cloud, it is difficult to say with a straight face that the Bull market may soon resume.
Shorter-term resistance will be at the Opening Range high of August at 102.645. When hope springs for a new uptrend, a series of higher low is typically the best place to focus. That high-low and significant current support is ¥99.975 per USD. Below the higher low, the Friday, June 24 low of 98.77 will be watched to see if there is any hope for JPY bears.
Below there, you can look to the 61.8% Fibonacci Retracement of the 2011-2015 range at 94.83. Given the recent volatility, a new breakdown could easily bring us to these levels. Should we break below these levels, expect to hear from the Bank of Japan.
However, USD/JPY Sentiment Shows Traders Still Have Hope For Upside

When looking at sentiment, the most pressing development is a rise in new short positions. As of Friday, the ratio of long to short positions in the USDJPY stands at 3.77, as 79% of traders are long.
To See How Live Clients Are Positioned In FX & Equities Click Here Now
Yesterday the ratio was 4.09; 80% of open positions were long. Long positions are 4.7% lower than yesterday and 6.7% below levels seen last week. Short positions are 3.2% higher than yesterday and 5.8% above levels seen last week. Open interest is 3.1% lower than yesterday and 8.5% above its monthly average.
We use our SSI as a contrarian indicator to price action, and the fact that the majority of traders are long gives a signal that the USDJPY may continue lower. The trading crowd has grown less net-long from yesterday and last week. The combination of current sentiment and recent changes gives a further mixed trading bias.
Shorter-Term USD/JPY Technical Levels: August 12, 2016
For those interested in shorter-term levels of focus than the ones above, these levels signal important potential pivot levels over the next 48-hours.

T.Y.


