


See How FXCM’s Live Clients Are Positioned In FX & Equities Here
Talking Points:
- USD/JPY Technical Strategy: Triangle Formation Below 115.55 Favors Range For Now
- Risk Sentiment on March 1 Left JPY As Weakest Currency To Start March
- A Nikkei Move Higher Would Align With USD/JPY Pushing Into Resistance
USD/JPY is coming off its largest monthly drop in February since October 2008. Of course, the subsequent move was a multi-year gain in the JPY. The next move will likely include a good deal of volatility, even if we do not have a clear understanding of direction going forward.
Looking to other asset classes like US Treasury yields that saw the 10Y climb as much as 10bps on Tuesday shows that the pressure to buy JPY is letting up for now. The 2-year yield is equally interesting as it is more of a proxy for expected monetary policy. For example, we see divergences in traditional stronghold relationships in other JPY crosses starting to favor JPY shorts.
Additionally, we see a boost in equity markets, which are also supporting the JPY crosses higher with 111 being a key support for now in USD/JPY. SPX500 has moved higher ~10% from the February 11 low and a further push higher could continue to favor the range with a push toward former long-term support, new potential resistance at 115.00/55.
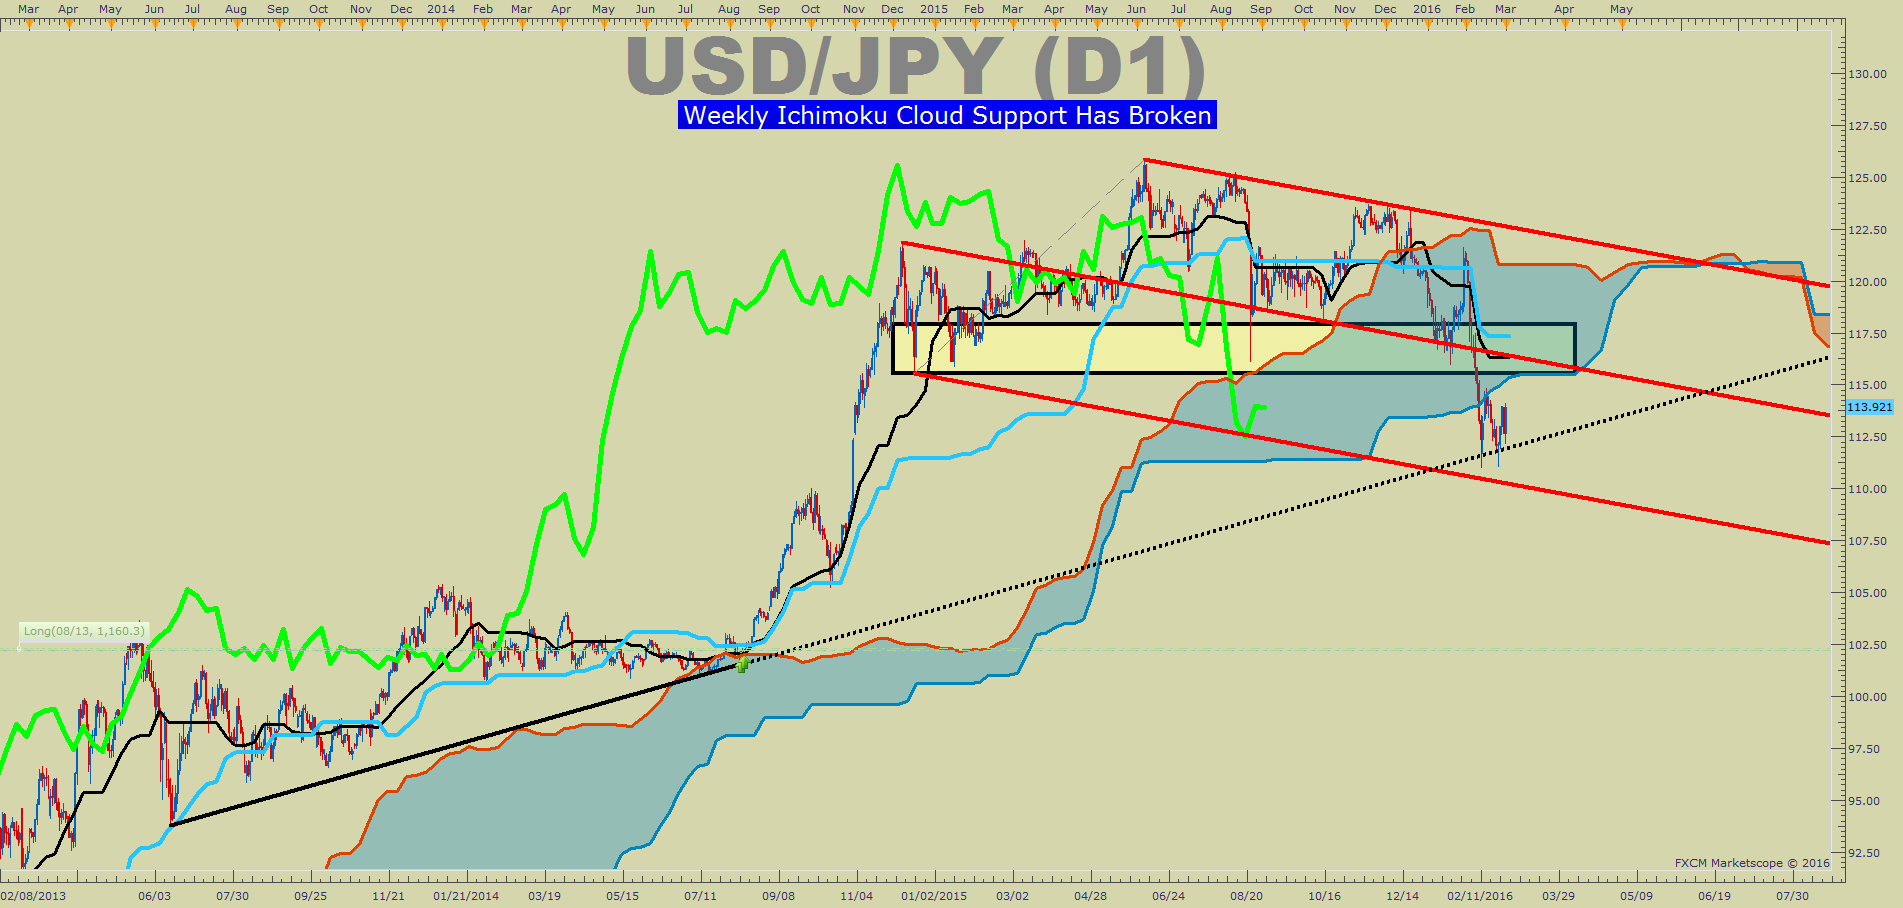
115.55 Key Resistance on USD/JPY
Key Levels from Here
USD/JPY does appear to be holding support between 111/12 for now. This sign of stabilization could support a short-term rally since we have moved above prior resistance of 112.95. In the meantime, we could see this current trend aligning with a move higher toward the 21-DMA on the chart below, and higher toward 115.00/55.
On the chart above, you can see that a long-term trend-line may be holding up the price for now. Traders looking for specific key levels to grasp should be looking to the ~75 pip range from 112.27-113.02 that comprises the February 24 and February 25 lows.

T.Y.
Interested In Learning the Traits of FXCM’s Successful Traders? If So, Click Here


