To receive Tyler’s analysis directly via email, please SIGN UP HERE
Talking Points:
- USD/JPY Technical Strategy: Looking to Sell Resistance
- Recent Breakdown Favors Further Downside
- Time Below 200-Day Moving Average Shows Comfort With ‘Lower For Longer’
You could say that as goes USDJPY, so goes global markets. If that is the case, a handful of worrying signs is in store over the near-term. First, the 200-day moving average is easy to use, widely-held mood barometer for any market. In short, if the price is above the moving average, things are looking good, and buyers likely believe the will come before more buyers, and the opposite holds true when the price is below the 200-day moving average. As you can see below, USDJPY is looking comfortable (as per lack of volatility), below the 200-day moving average and if something pushes JPY higher and USDJPY lower, a breakdown would likely have little support.
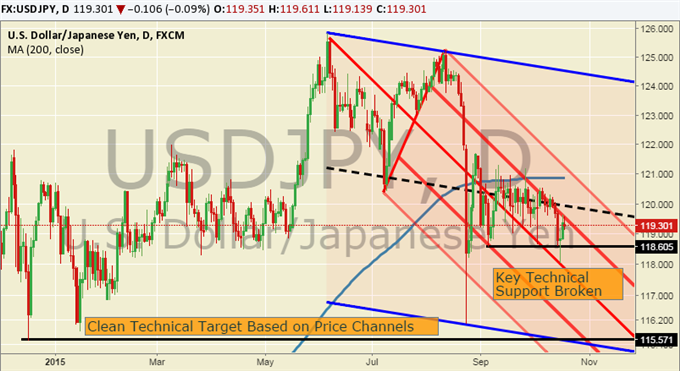
The key technical support of 118.60 was recently broken, although price did not close below this level. A close is seen as firmer proof that the market believes we should below a level and possibly lower. We are still within the extremes of the August 24th fallout, and more patient traders may wait for these levels to break. However, in the interim, the breakdown below the September 4th low and Aug. 24th close of 118.40/58, opens the door for a challenge of 116.082 and the December ’14 low of 115.57, if not lower.
JPY strength has been somewhat absent as the S&P 500 continues to move higher towards 2,042 level resistance. Given the break of the September 4th low, selling resistance is the preferred approach. However, attention should be paid to the dollar index. A break and close above the critical 11,970 – 11,931 zone would make any immediate downside much less likely. Until then, the 120.60-121.30 will provide focal levels to sell with attractive risk: reward offerings. T.Y.
Add these technical levels directly to your charts with our Support/Resistance Wizard app!