


To receive Ilya's analysis directly via email, please SIGN UP HERE
Talking Points:
- USD/JPY Technical Strategy: Flat
- Support: 123.66, 122.80, 121.42
- Resistance: 124.78, 126.31, 127.25
The US Dollar produced a Bearish Engulfing candlestick pattern, hinting a top may be set below the 125.00 figure against the Japanese Yen. Near-term support is at 123.66, the 14.6% Fibonacci retracement, with a break below that on a daily closing basis exposing the 23.6% level at 122.80. Alternatively, a turn above the 100% Fibexpansion at 124.78 clears the way for a test of the 123.6% threshold at 126.31.
Bearish follow-through has been absent thus far, with directional conviction unlikely to emerge until after the passing of the US Employment report. We remain flat for now and wait for event risk to pass before committing to a trade.
Add these technical levels directly to your charts with our Support/Resistance Wizard app!
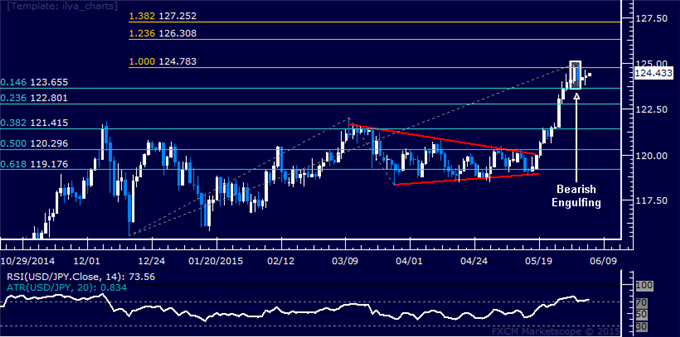
Daily Chart - Created Using FXCM Marketscope
--- Written by Ilya Spivak, Currency Strategist for DailyFX.com


