


USD/CNH Price Technical Forecast
USD/CNH – Trading Higher
On Friday, US Dollar rallied against Chinese Yuan to 7.0572 – its highest level in two and half months on the back of Coronavirus developments. The market retreated after, yet the weekly candlestick closed in the green with 1.2% gain.
Alongside that, the Relative Strength Index (RSI) remained above 50 indicating that bulls were in charge.
USD/CNH DAILY PRICE CHART (May 1, 2018 – FEB 26, 2020) Zoomed Out


USD/CNH DAILY PRICE CHART (SEp 24 - FEB 26, 2020) Zoomed In
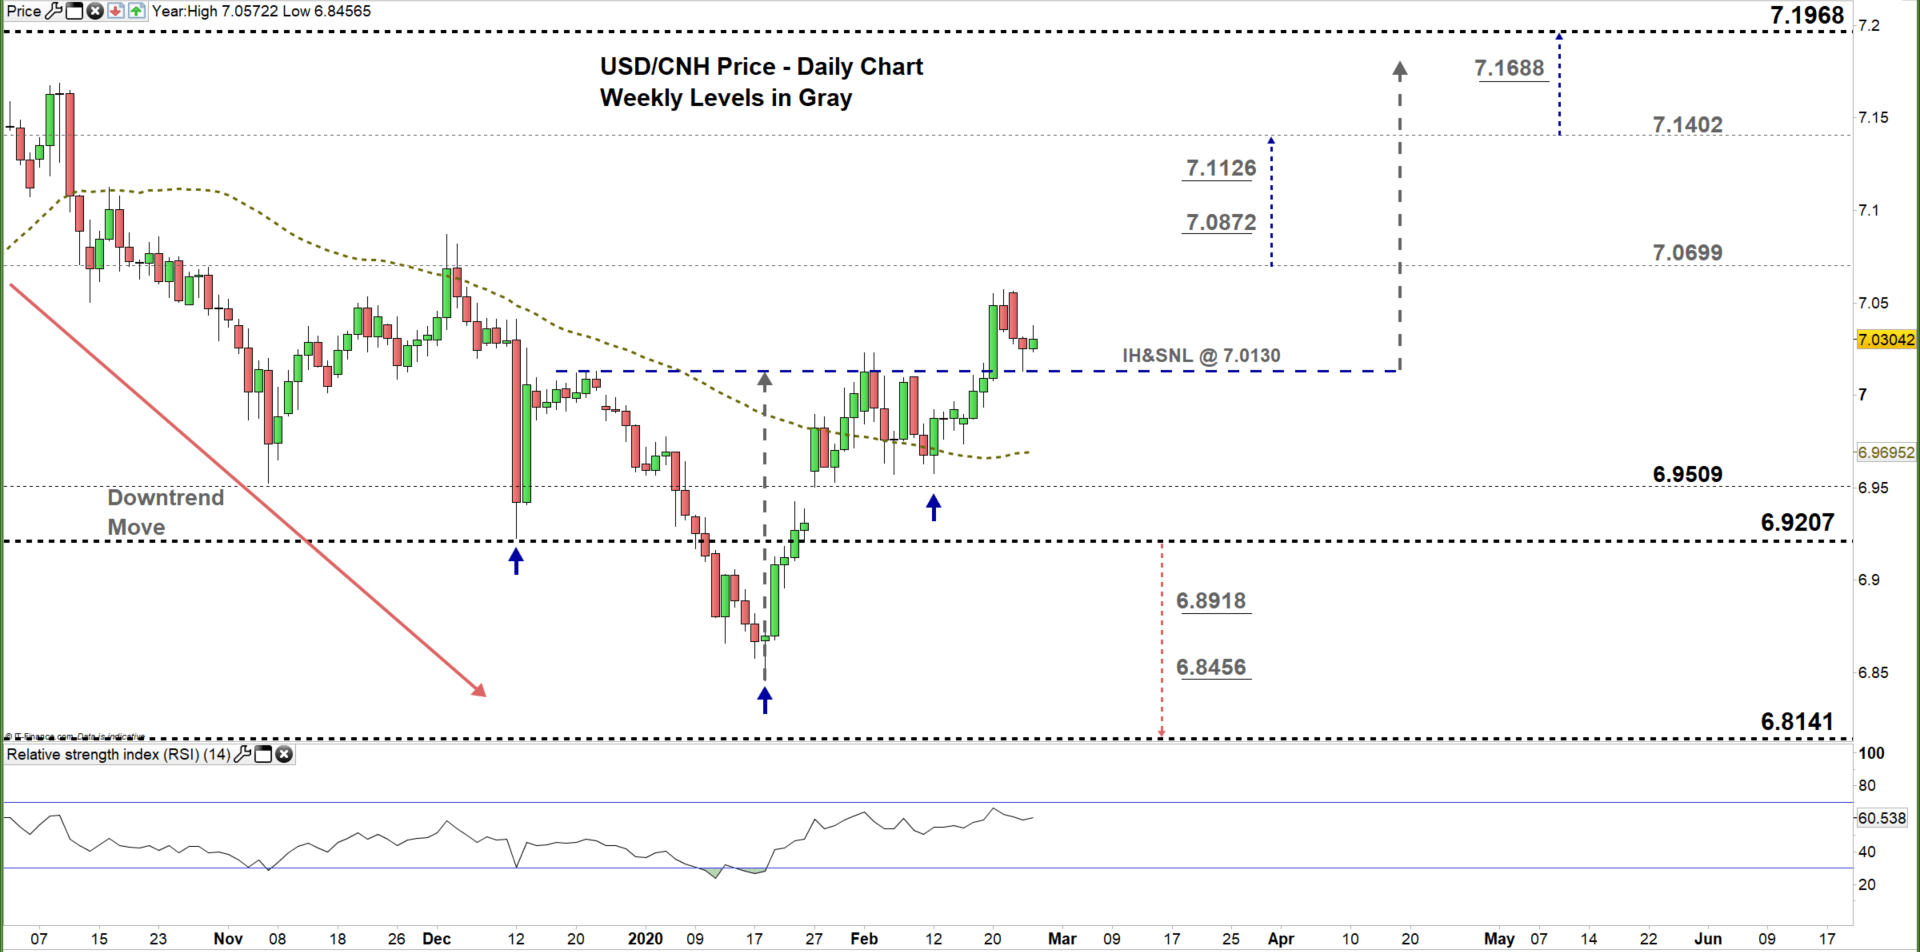
From the daily chart, we noticed on Jan 27 USD/CNH opened with a gap to the upside and moved to a higher trading zone 6.9509 – 7.0699. Thus, a close above the high end of the zone may cause a rally towards 7.1402.
On February 20, USDCNH broke above the neckline of inverted head and shoulders pattern at 7.0130 eyeing a test of 7.1688. Yet, the weekly resistance levels and trading zone/s marked on the chart (zoomed in) should be kept in focus. It’s worth noting that, any violation of the neckline would negate the pattern.
Any failure in closing above the high end of the zone, could reverse the pair’s direction towards the low end of the zone. Further close below 6.9207 might lead USDCNH towards 6.8141. That said, the weekly support levels underscored on the chart should be considered.

USD/CNH four hour PRICE CHART (Jan 23 – FEB 26, 2020)

Looking at the four- hour chart, we notice that on late January USD/CNH started uptrend move creating higher highs with higher lows. On Feb 5, the market paused that move as carved out a lower high at 7.0103.
On Feb 20, the pair resumed bullish price action and created in the following day a higher high at 7.0572. Thus, a break above 7.0872 could cause more bullishness towards 7.1126. Although, the resistance level underlined on the chart would be worth monitoring.
On the other hand, a break below 7.0079 could send USDCNH towards 6.9627. Nevertheless, the daily support level printed on the chart should be watched closely.
See the chart to figure out more about key levels to monitor in a further bullish/bearish move.
Written By: Mahmoud Alkudsi
Please feel free to contact me on Twitter: @Malkudsi


