


Talking Points:
- Difficult to find reasonable risk-reward scenarios due to “Brexit”
- Potentially game-changing implications for global financial markets as a whole
- Very long term view might be required for now as we approach the vote
Volatility is set to be high with the Brexit vote. Learn good trading habits with the “Traits of Successful Traders” series
The US Dollar is trading sideways versus the Chinese Yuan in offshore trade, as price appears to test short term resistance around 6.5880.
The sideways movement is expected to dramatically shift in the hours and days ahead, as we rapidly approach a resolution to the so called “Brexit” referendum, which could have significant implications for the global financial markets as a whole.
Indeed, it appears difficult to find any tradable scenarios at the moment, due to the uncertainty and expected volatility, which in turn might imply that a very long term view is required for the hours and days ahead, as short term technical levels seem unlikely to have any significance. Taking this into consideration, we turn our attention to the Monthly chart.
USD/CNH Monthly Chart: June 23, 2016
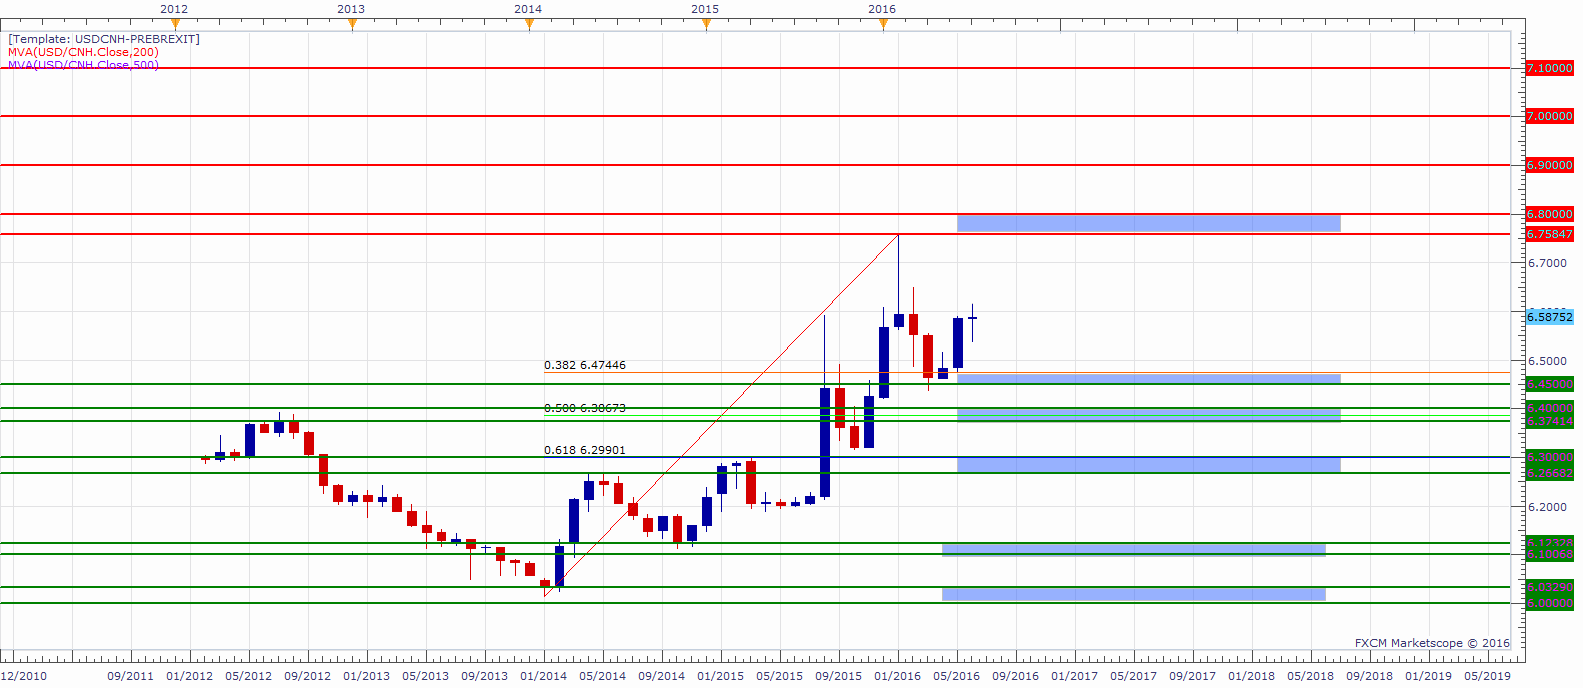
The long term up trend from 2014 is in focus looking at the chart above. The Fib drawn from the January 2014 low at 6.0150 to the January 2016 high at 6.75847 reveals possible interesting levels on a move lower.
The first long term support could potentially be the 0.382 Fib at 6.47446, which along with a prior support at around 6.4500 could form a zone of interest to buyers.
Further levels of interest on a move lower could be a confluence of support below the 0.64 handle combined with the 0.50 Fib and the July 2012 highs.
Below that area, the 0.618 Fib coincides with the 6.30 handle, and the 6.2668 level defines a possible support zone.
Possible levels of resistance on a move higher might start from the 2016 highs at 6.75847, which together with the 6.80 handle could act as a possible resistance zone.
A breach above could potentially put the focus on the big “round figures” at the 6.90, 7.00 and 7.10 handles.
--- Written by Oded Shimoni, Junior Currency Analyst for DailyFX.com
To contact Oded Shimoni, e-mail instructor@dailyfx.com


