


Talking Points:
- USD/CNH appearing to test short term support at 6.5880
- The pair has failed to close above the 6.6000 handle for two consecutive days since February
- A clear move above 6.6000, and a hold, may put the focus on the 6.6500 level
Learn Good Trading Habits with the “Traits of Successful Traders” series
The US Dollar is edging slightly lower versus the Chinese Yuan in offshore trade (at the time this report was written), as price appears to test short term support around 6.5880.
After finding support at 6.5500 the pair moved higher to test the 6.6000, but has yet to manage a clear break and a hold above on a daily close basis. The pair has failed to hold above the level for two consecutive days since February.
It seems that the pair might need to “make a decision” around the 6.5880 short term support level. If the pair manages to hold above the level, buyers could potentially attempt another move higher to break the 6.6000 handle.
If price is able to break above 6.6000 and hold higher, it might initially expose possible resistance at the February 3 high around 6.6500.
A break below 6.5880 may put the focus again on the 6.5500 prior support.
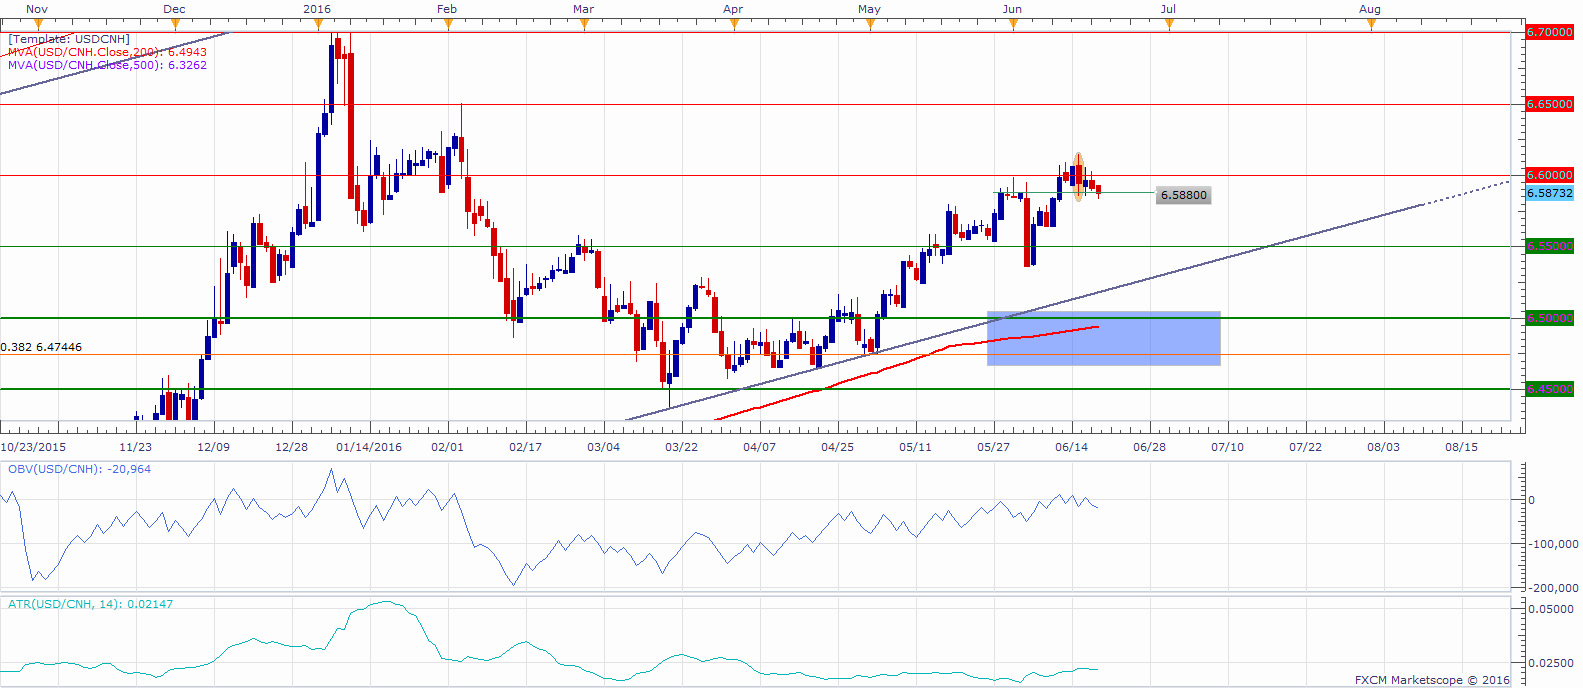
A break below that level could put the spotlight on a major support confluence zone (marked blue) that combines the 6.5000 handle, 200 day SMA, trend line from October 2015, and the 6.47446 level, which is the 0.382 Fib from the long term up trend as marked from the 2014 low at 6.0150.
USD/CNH Daily Chart: June 20, 2016
--- Written by Oded Shimoni, Junior Currency Analyst for DailyFX.com
To contact Oded Shimoni, e-mail instructor@dailyfx.com


