


Euro and US Dollar Price Outlook
Did you check our latest forecasts on USD and EUR and Gold? Find out more for free from our Q3 forecasts for commodities and main currencies
Weaker EURO Across the Board
Last week Euro and US dollar declined against the Swiss franc. EURCHF closed the weekly candlestick with a near 0.7% loss meanwhile USDCHF closed on Friday with a smaller 0.3% loss. This week EUR continued losing value against CHF however, USD firmed slightly and recouped some of last week losses.
Alongside this on Monday, the Relative Strength Index (RSI) crossed below 30 and remained in the oversold territory emphasizing the strength of the downtrend momentum for EURCHF. On the other hand, the oscillator U-turned on USDCHF from 40 and climbed to 47 indicating the buyer's attempt to dominate.
Just getting started? See our Beginners’ Guide for FX traders
USD/CHF Daily Price Chart (May 24, 2017 – JULY 24, 2019) Zoomed Out

USD/CHF Daily Price Chart (April 6 – JULY 24, 2019) Zoomed IN
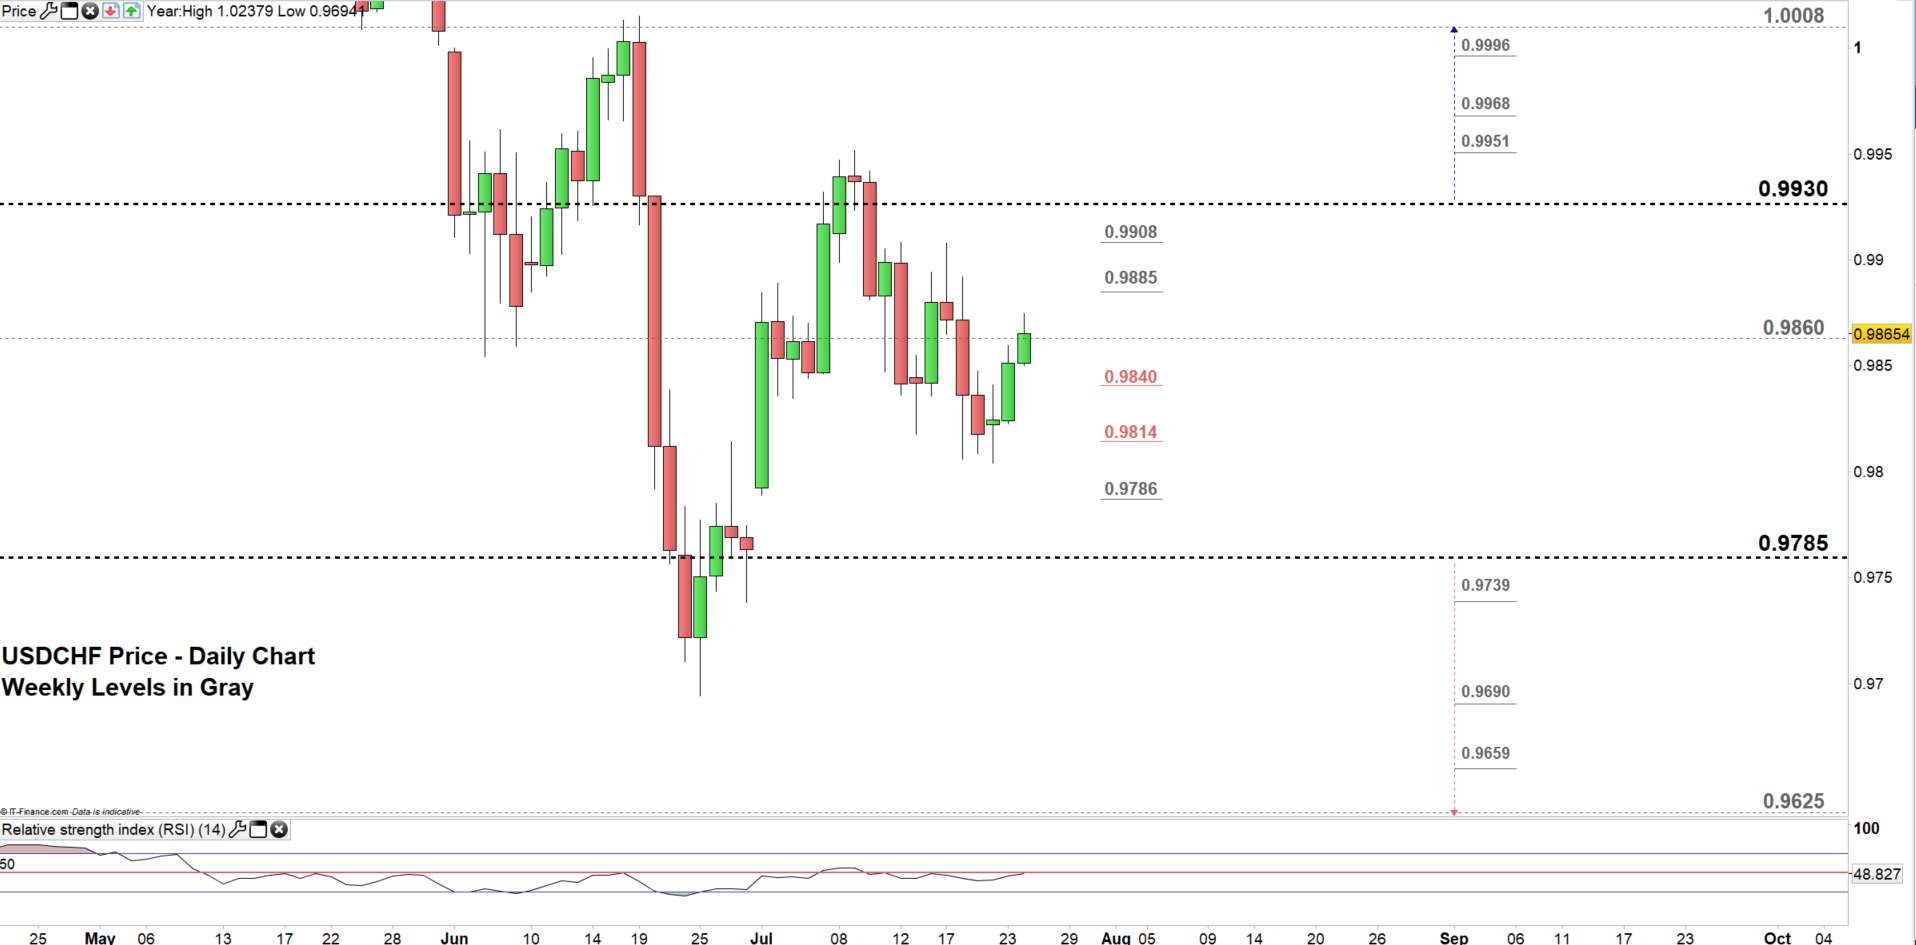
Looking at the daily chart, we notice today USD/CHF tested the higher trading zone 0.9860- 0.9930 hence, a close above the low end of this zone could push the price towards the high end. However, the weekly resistance levels underlined on the chart (zoomed in) need to be watched closely. Further close above the high end threshold may cause a rally towards 1.0008 although the weekly/monthly resistance levels underscored on the chart should be considered.
In turn, any failure in closing above the low end of the aforementioned trading zone might see the pair trading towards 0.9785. However the daily and weekly support levels underlined on the chart (zoomed in) would be worth monitoring.
Having trouble with your trading strategy? Here’s the #1 Mistake That Traders Make
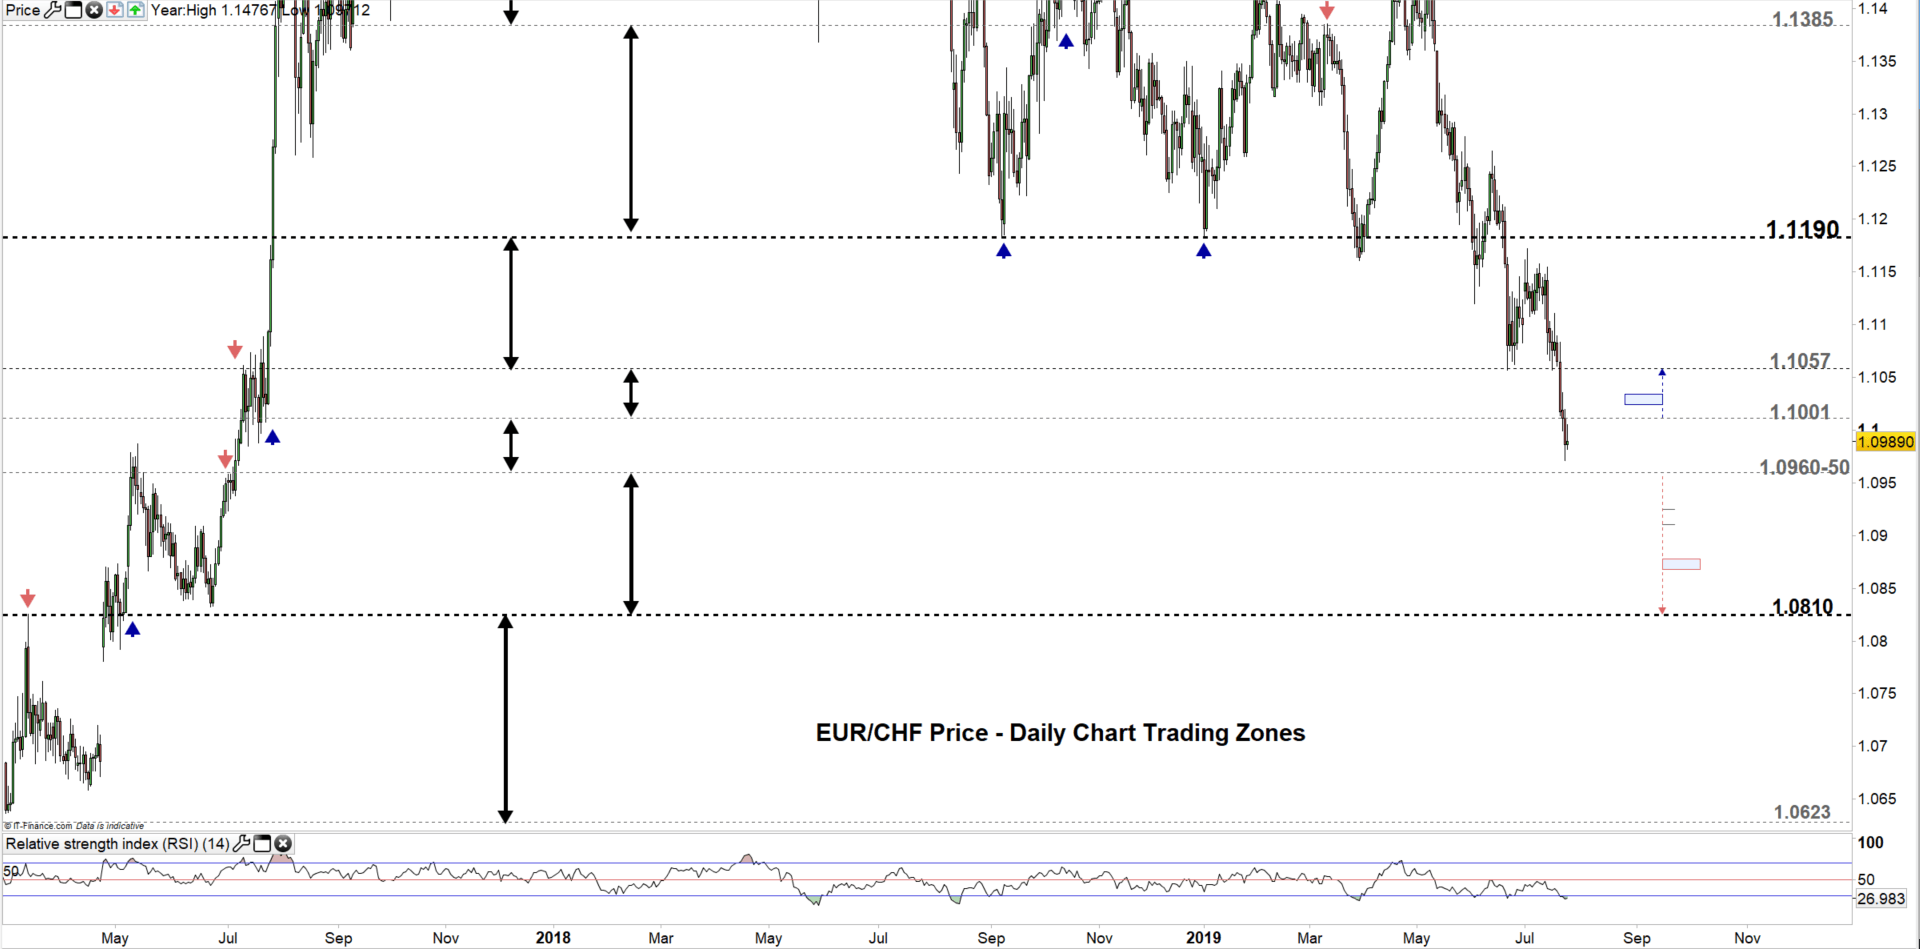
EUR/CHF Daily Price Chart (March 1, 2017 – JULY 24, 2019) Zoomed Out
EUR/CHF Daily Price Chart (MAY 31 – JULY 24, 2019) Zoomed IN
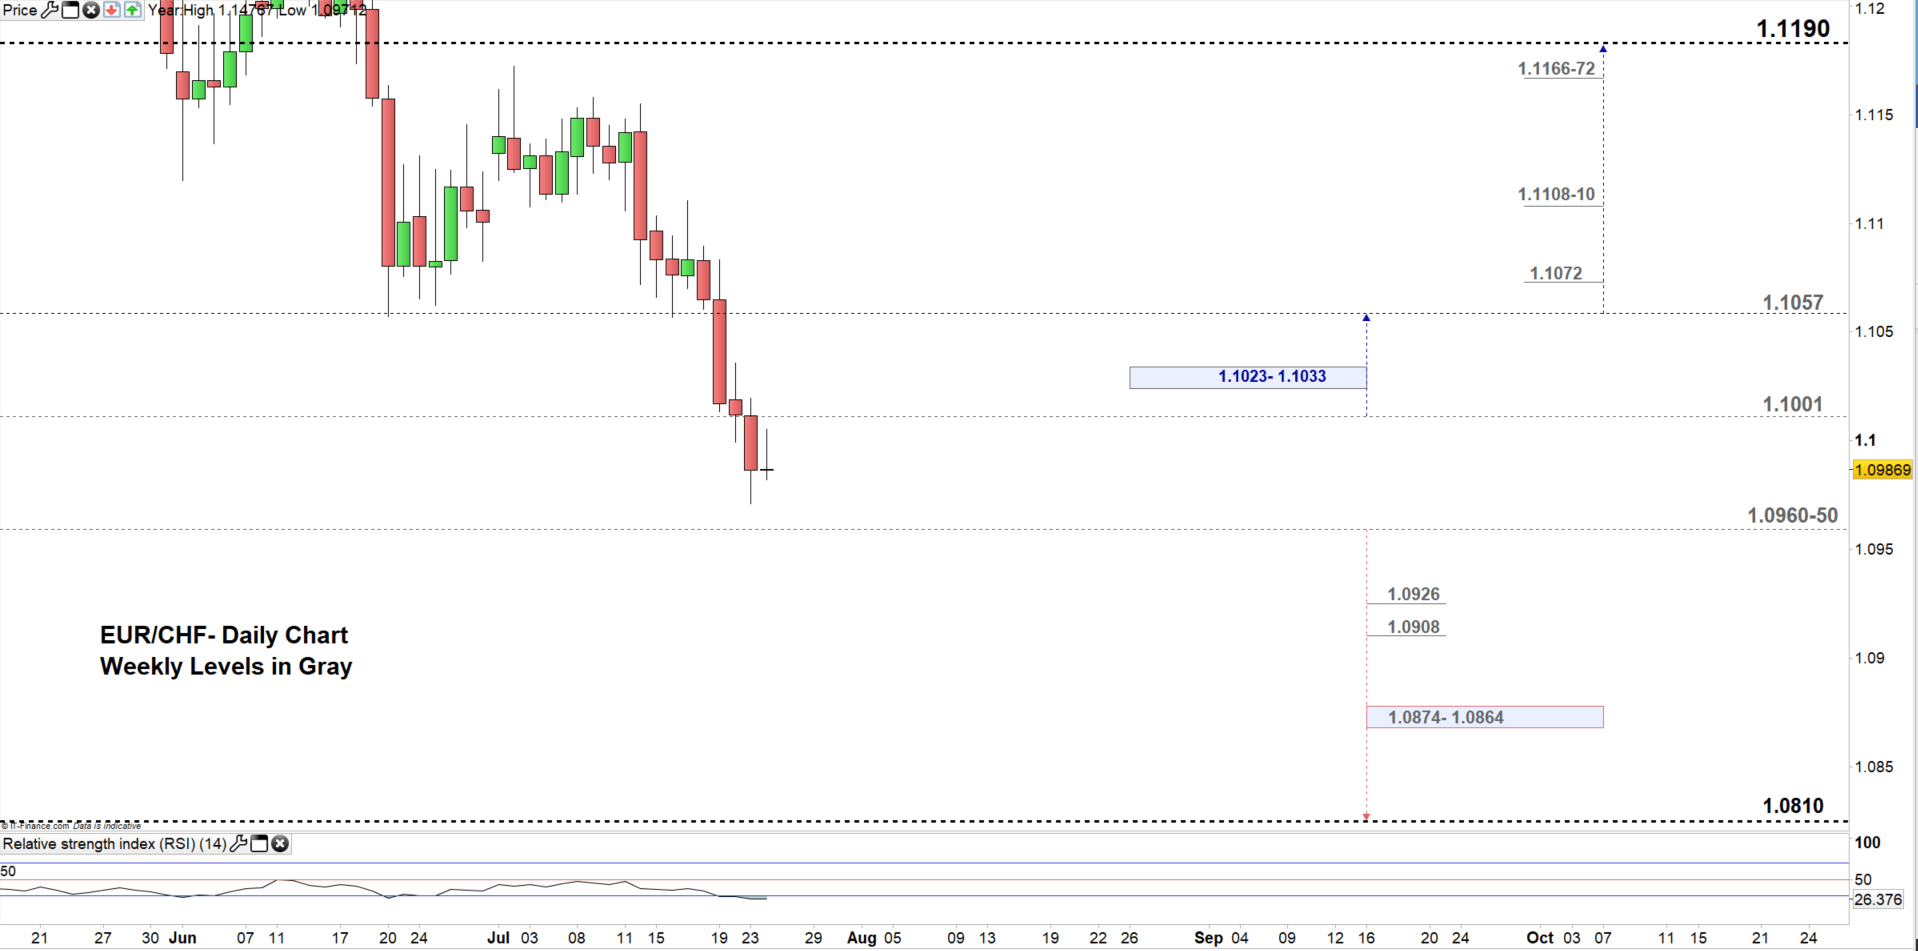
Looking at the daily chart, we noticed yesterday that EUR/CHF closed in a lower trading zone 1.0950- 1.1001 and today the pair eyes the low end of this zone. Therefore, a close below the low end threshold may lead the price towards 1.0810. Nonetheless the weekly support levels and zone marked on the chart (zoomed in) should be watched along the way.
On the other hand, any failure in closing below the low end or a rebound from 1.0960 may cause a rally towards the high end of the aforementioned trading zone. Further close above the high end could cause more bullishness towards 1.1057 although the resistance zone highlighted on the chart needs to be kept in focus.
Written By: Mahmoud Alkudsi
Please feel free to contact me on Twitter: @Malkudsi


