


USD/CHF Price Forecast, Charts and Analysis
- US Dollar looking ahead to important data release tomorrow, including NFP figures.
- USD/CHF bears hesitation in sending the price lower.
Find out more about USD price outlook through mid-year, download for free Q2 major currencies forecasts
To learn more about data releases for this week check out DailyFX Economic Calendar
USD/CHF – Bearish Trend Losing Momentum
On May 31, USD/CHF continued its bearish trend after testing the levels discussed in our previous article. At the same day, the monthly candlestick closed with 1.8% loss at 1.0008.
On Jun 3, USD/CHF opened the week’s session with a downside measuring gap leading the pair to trade even lower. Yesterday, the price broke below the March 20 low printing 0.9854 its lowest level in nearly five months. However, it rallied after closing at 0.9940 highlighting the bears hesitation in sending the price lower.
Alongside this development, the relative strength index (RSI) failed to shift to the oversold territory below 30 and rose yesterday to 35 reflecting a slight weakness in the bearish momentum.
USD/CHF Daily Price Chart (Oct 15, 2018 - June 6, 2019) Zoomed in
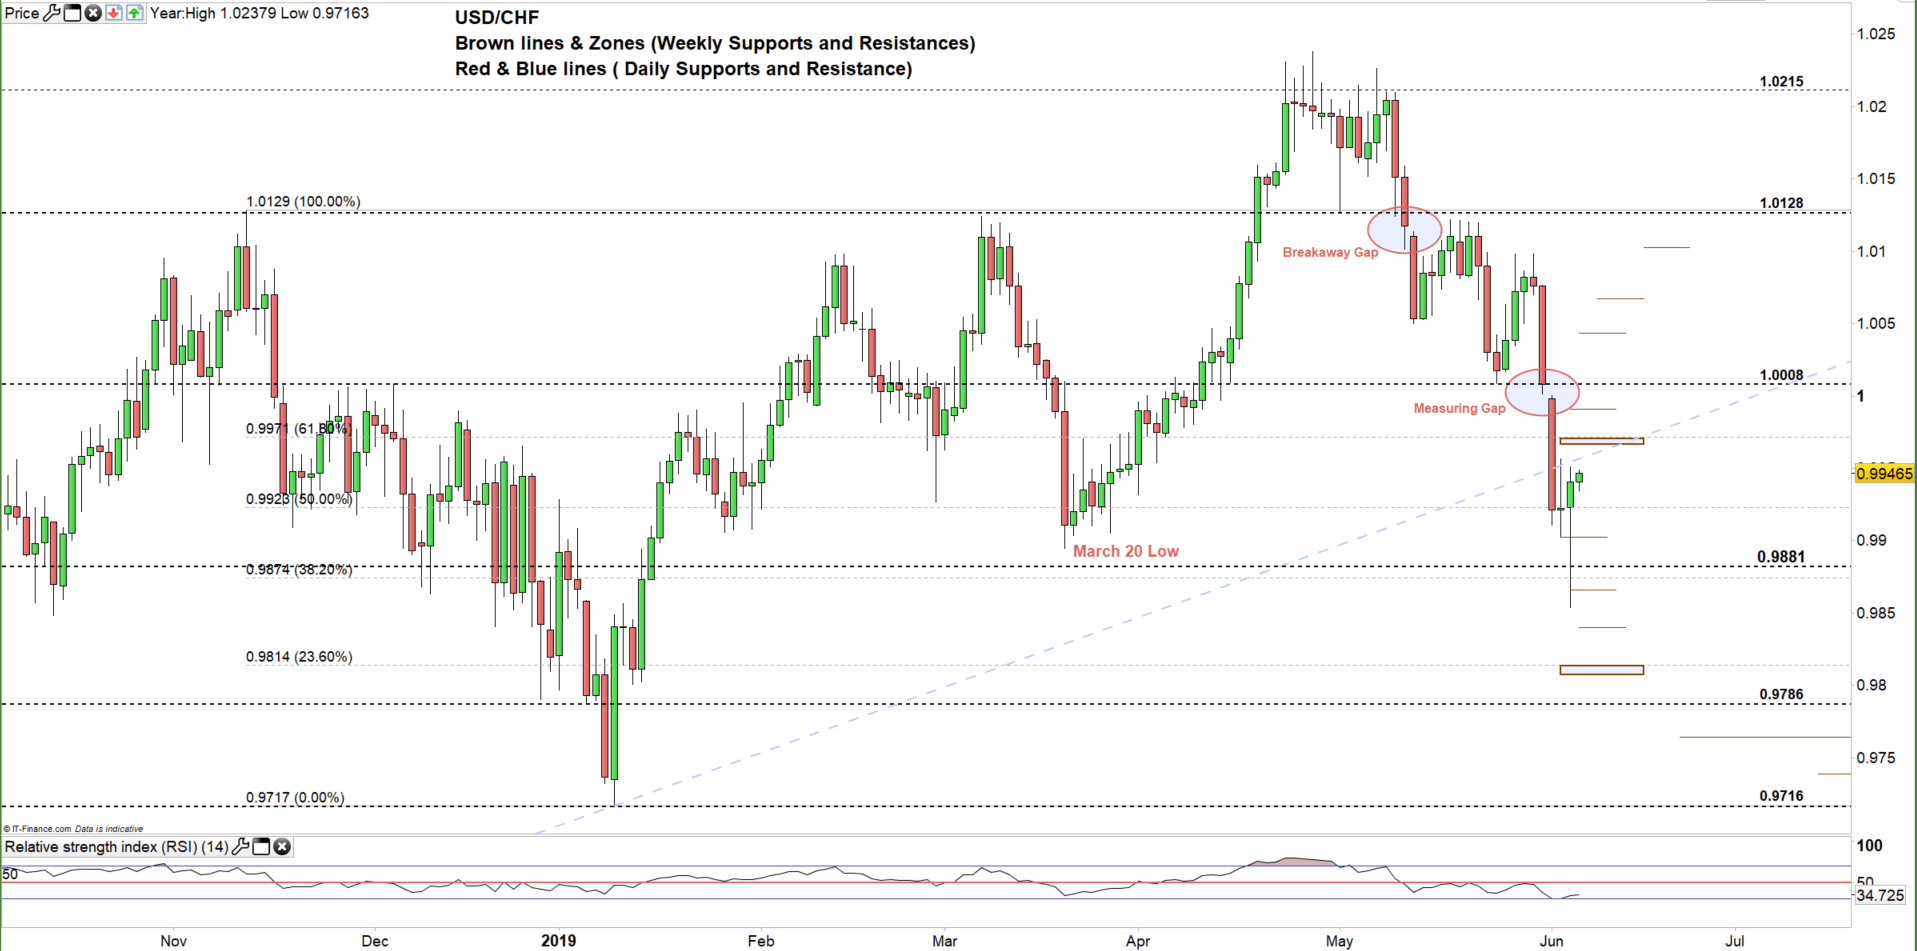
USD/CHF Daily Price Chart (April 20, 2018 – June 6, 2019) Zoomed Out

Just getting started? See our Beginners’ Guide for FX traders
Looking at the daily chart we notice yesterday that USD/CHF pulled back to the trading range (0.9881- 1.0008) after rebounding from 0.9854. Therefore, the pair might try to test the higher end of the mentioned range. However, both 0.9971 (61.8% Fibonacci retracement) and the weekly resistance at 0.9991 need to be watched closely.
Any close above 1.0008 would mean that USD/CHF may move to the higher trading range (1.0008- 1.0128) with more likelihood to see the higher end. Although, weekly resistances at 1.0042, 1.0068 and 1.0100 need to be in focus.
In turn, a close below 0.9881 could mean more bearishness towards 0.9786. Weekly support levels at 0.9866, 0.9840 and 0.9808 are worth monitoring.
Having trouble with your trading strategy? Here’s the #1 Mistake That Traders Make
USD/CHF Four-HOUR PRICE CHART (May 16 –JUN 6, 2019)
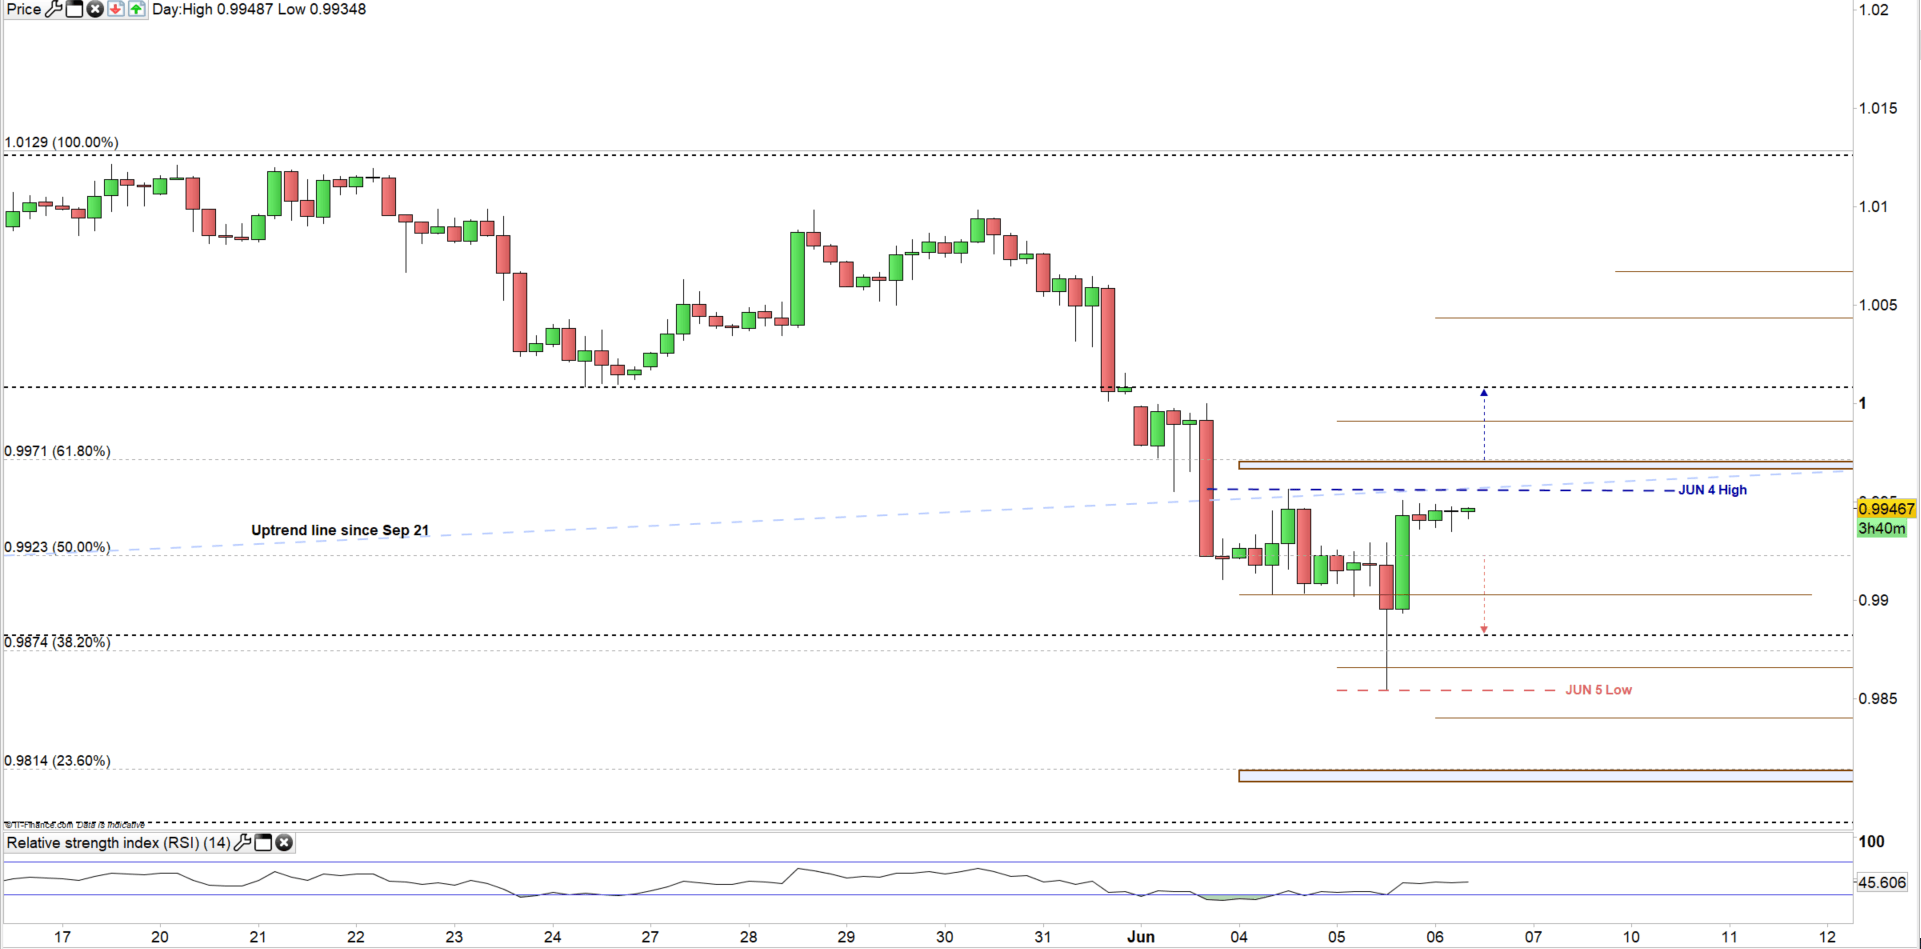
Looking at the four-hour chart, we notice the price rebounded on Jun 4 at 0.9956 and since then failed to break above. This level meets today with the up-trend line originated from the Sep 21 low at 0.9542. Therefore, any break above this threshold could start up a bullish move towards 1.0008. However, resistance levels mentioned above need to be considered.
On the flipside any break below 50% Fibonacci retracement at 0.9923 could send the price to retest 0.9881. The weekly support at 0.9904 is worth monitoring.
Written By: Mahmoud Alkudsi
Please feel free to contact me on Twitter: @Malkudsi


