


Talking Points:
- USD/CHF Technical Strategy: Longer-term range-bound, intermediate-term bearish & shorter-term mixed.
- USD/CHF price action remains rather messy after breeching-below a key support zone earlier in the month.
- If you’re looking for trading ideas, check out our Trading Guides. They’re free and updated for Q1, 2017. If you’re looking for ideas more short-term in nature, please check out our IG Client Sentiment.
To receive James Stanley’s Analysis directly via email, please sign up here.
In our last article, we looked at a confluent zone of support in USD/CHF in the effort of catching a topside move in the pair. And while that support held for a few days, it was unable to offset the continued drive of sellers until, eventually, support gave way as price action set a fresh seven-month low at .9614. Making up that support zone were two longer-term Fibonacci levels combined with a bullish trend-line projection that can be found by connecting the May, 2015 low to the low from last November’s elections.
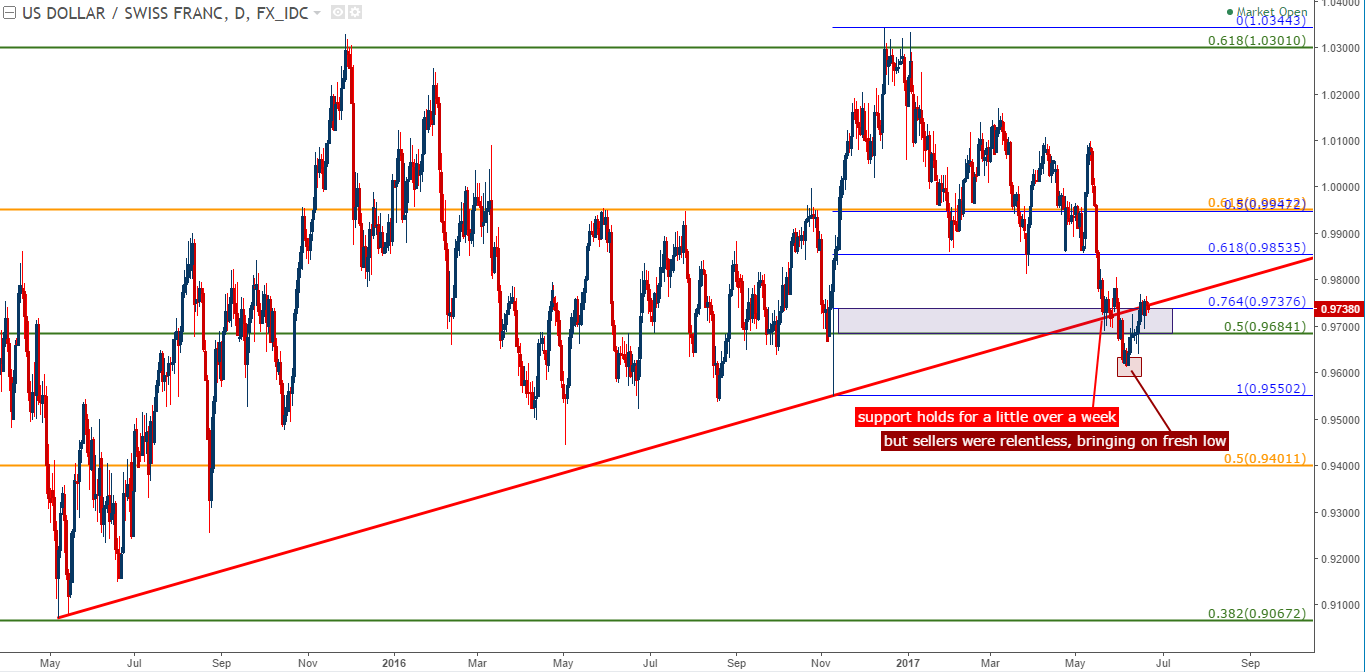
Chart prepared by James Stanley
You might notice that near-term price action in USD/CHF looks a bit messy at the moment; and since we’ve run into this confluent zone of support, shorter-term price action in Swissy has been very much like barbed wire. So, for clarity’s sake, we’re dialing out to the weekly chart below, and isolating this trend-line in the effort of getting a better perspective of current dynamics in USD/CHF price action.

Chart prepared by James Stanley
The above chart helps to highlight how we may be looking at what could be bearish continuation prospects in USD/CHF. There are, however, some challenges to such an approach given our current context, chief of which is the fact that the U.S. Dollar appears to be gaining ground, and this, of course, could be a headwind for short USD/CHF scenarios.
However, for those that are looking for or are comfortable with taking on short-USD exposure, attractive risk-reward could be available by trading on recent price action dynamics. On the chart below, we’re looking at three support and resistance levels applied to USD/CHF based on recent price action. Traders that are entertaining a short stance can look to wedge stops above either level of resistance based on how aggressively they want to treat the move, while the three support levels can be used as profit target(s) for a down-side approach.
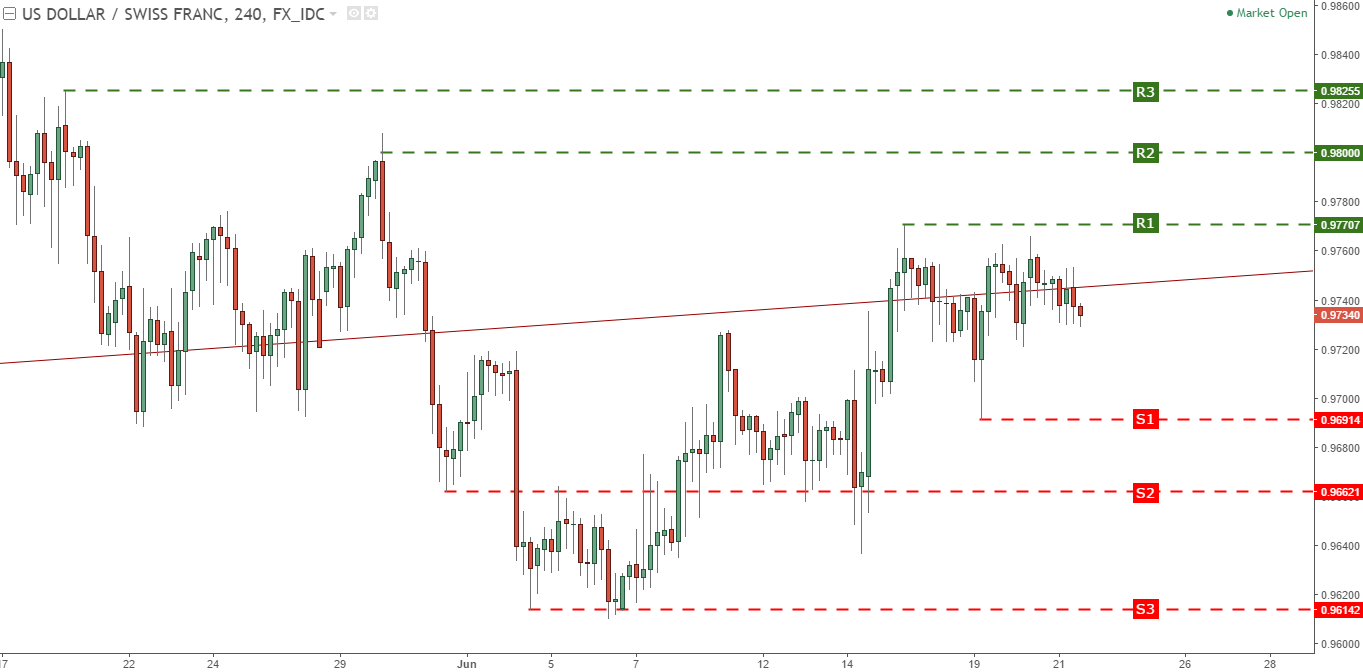
Chart prepared by James Stanley
--- Written by James Stanley, Strategist for DailyFX.com
To receive James Stanley’s analysis directly via email, please SIGN UP HERE
Contact and follow James on Twitter: @JStanleyFX


