


To receive James Stanley’s Analysis directly via email, please sign up here.
Talking Points:
- USD/CHF Technical Strategy: intermediate-term mixed, short-term, very choppy.
- While Swissy spent much of February trading-in a bullish channel, resistance around 1.0155 has proven difficult to break.
- If you’re looking for trading ideas, check out our Trading Guides. They’re free and updated for Q1, 2017. If you’re looking for ideas more short-term in nature, please check out our Speculative Sentiment Index Indicator (SSI).
In our last article, we looked at how a bullish month of February saw price action in Swissy trade-higher through much of the month; but a key level of resistance that showed-up in early-March has thus far proven difficult for USD/CHF to break. This eventually led to a break-below that up-ward sloping trend-channel, as shown below:
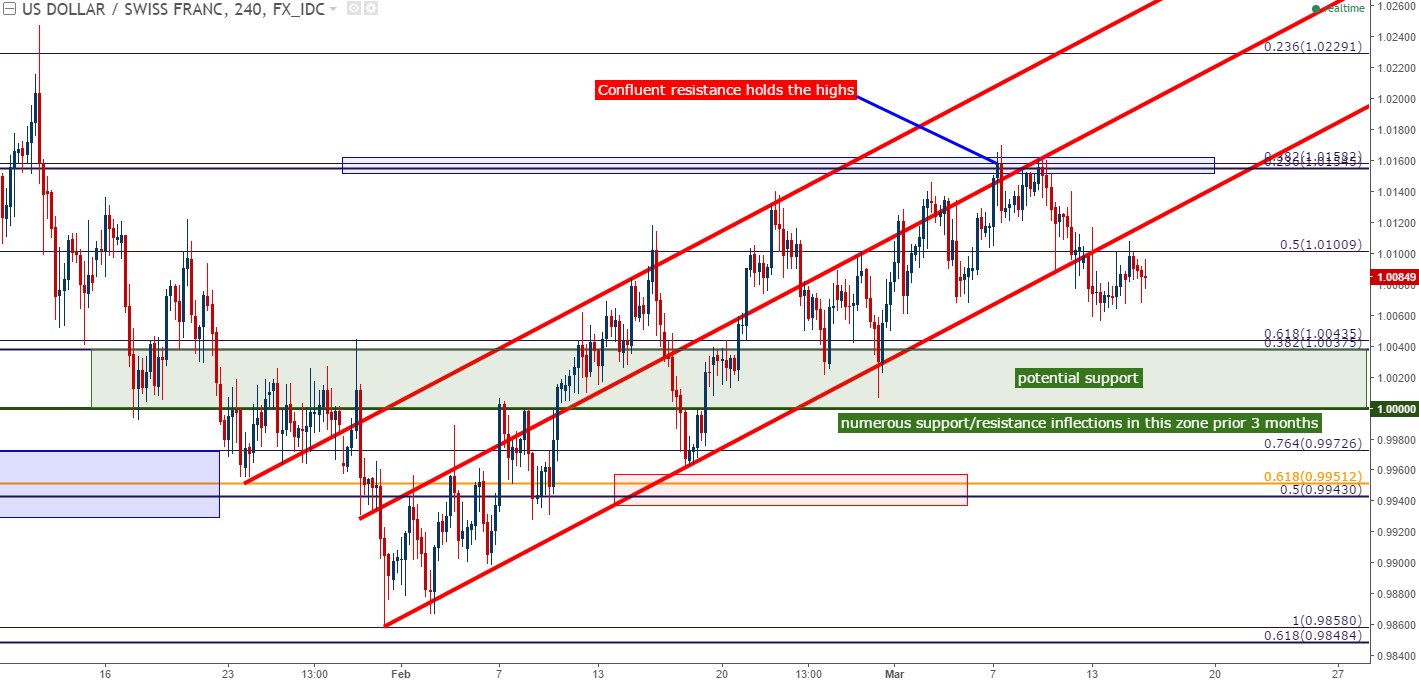
Chart prepared by James Stanley
For those that want to use the bearish break of the above trend-channel to investigate short-stances on the pair, they’d likely want to wait for the ~40-pip zone of support from parity up to 1.0044 to give way before pushing that theme. Parity is a pivotal psychological level in the pair, and over the past few months we’ve seen numerous support/resistance inflections around this zone; so while Swissy price action remains above parity, short-stances can prove challenging given that bears have been unable to retain control as price action has moved nearer to 1.0044.
On the bullish side of the pair, traders would likely want to wait for the short-term zone of resistance around 1.0101 to give way before proceeding-ahead. This is the 50% Fibonacci retracement of the most recent bearish move in the pair, taking the mid-December high down to the January 31 low. If buyers are able to push prices above this zone of resistance, traders can then look to get long on the next ‘higher-low’ in the pair, which would need to print above 1.0068 to remain as valid for a bullish-continuation approach.

Chart prepared by James Stanley
--- Written by James Stanley, Analyst for DailyFX.com
To receive James Stanley’s analysis directly via email, please SIGN UP HERE
Contact and follow James on Twitter: @JStanleyFX


