


To receive James Stanley’s Analysis directly via email, please sign up here.
Talking Points:
- USD/CHF Technical Strategy: intermediate-term mixed, near-term (past two weeks) bullish. .
- We looked at RSI divergence in our last article to highlight that the bearish move may be getting a bit stale, and since then bulls have returned to push prices-higher.
- If you’re looking for trading ideas, check out our Trading Guides. They’re free and updated for Q1, 2017. If you’re looking for ideas more short-term in nature, please check out our Speculative Sentiment Index Indicator (SSI).
In our last article, we looked at the breakdown of the prior up-trend in USD/CHF, as the robust bullish move in the second half of Q4, 2016 was facing continued retracement throughout the month of January. But as we advised, the bearish move was beginning to look a bit stale and stretched; and RSI divergence had already begun to show.
Since that article, we’ve seen a relatively smooth bullish trend channel appear as buyers have been able to push prices-higher by ~265 pips off of the lows, highlighted on the hourly chart below:

Chart prepared by James Stanley
The big point of contention in USD/CHF at the moment appears to rest with more broad-based U.S. Dollar themes. After the Greenback saw a near-historic run in the second half of Q4, 2016, the first month of 2017 saw an outsized retracement (which led to that stretched, bearish state we discussed in our last article). But with strength again showing in the Dollar in February, the prospect of bullish continuation can remain attractive in USD/CHF.
For top-side approaches, the level of parity is particularly interesting. This is a major psychological level that’s exhibited quite a bit of support and resistance action as USD/CHF has traded around this zone in the recent past. For those looking to gain bullish exposure, this can be a usable level in a couple of different ways. For more aggressive approaches, traders can look at lodging stops below this level with more near-term iterations of support, perhaps around the 1.0038 level. For those looking to exercise a bit more prudence or patience, waiting for support to show up around parity can open the door for top-side approaches with stops lodged below the .9900 zone of potential support.
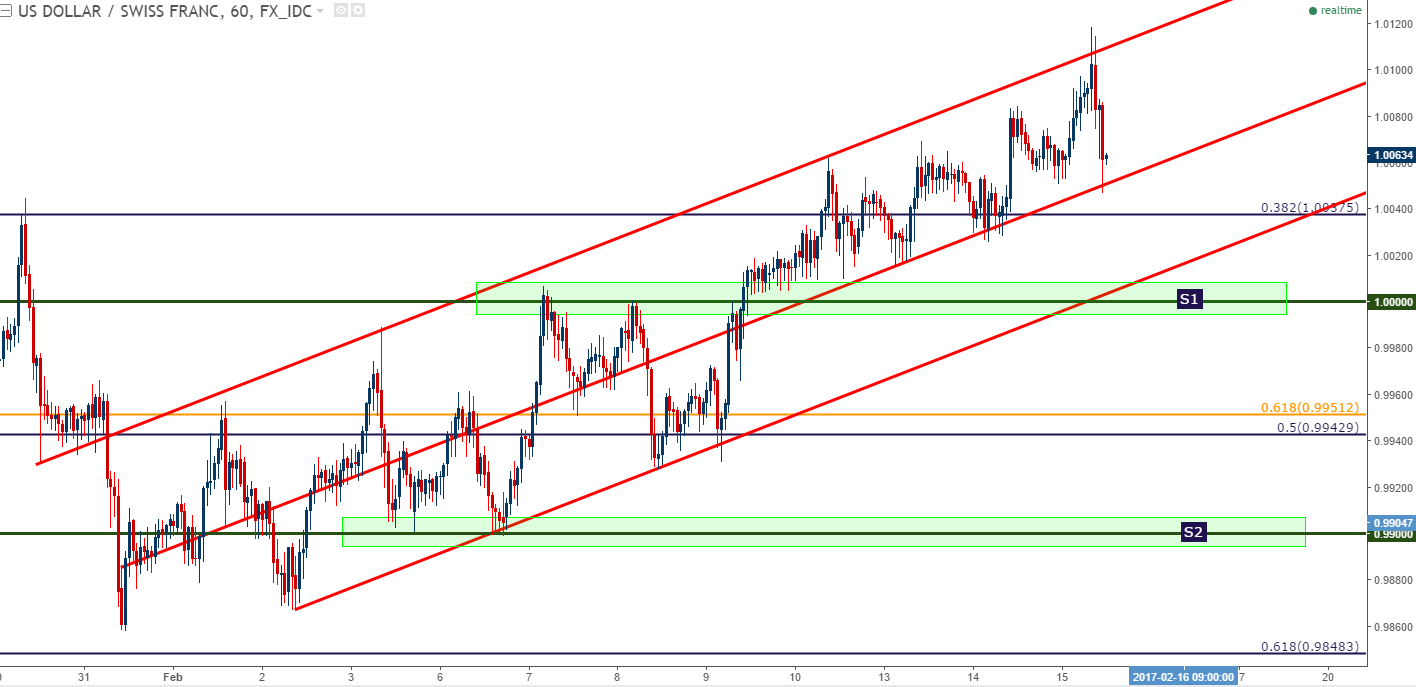
Chart prepared by James Stanley
--- Written by James Stanley, Analyst for DailyFX.com
To receive James Stanley’s analysis directly via email, please SIGN UP HERE
Contact and follow James on Twitter: @JStanleyFX


