USD/CAD Technical Outlook
- USD/CAD trending nowhere sets up for a big move
- Difficult to say which direction, go with the break


USD/CAD Technical Outlook: Tight Trading Conditions to Lead to Opportunity
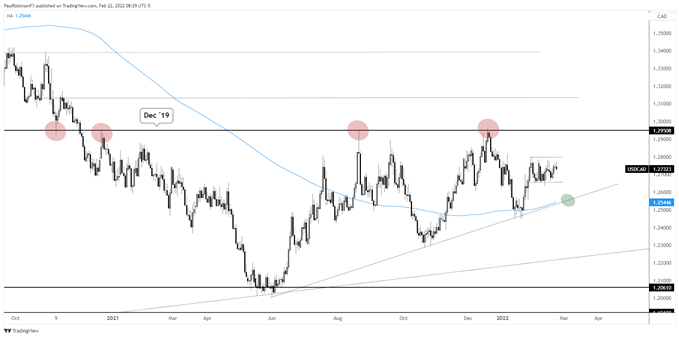
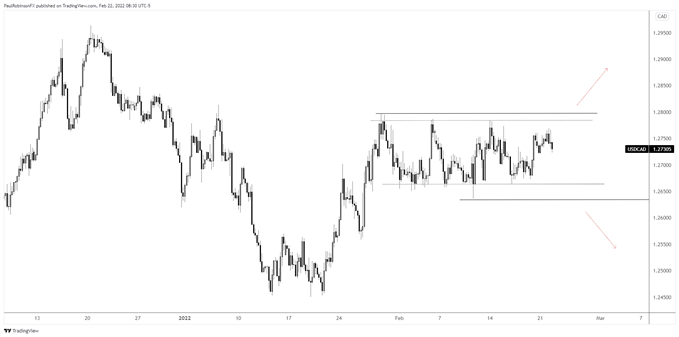
USD/CAD continues its sideways meander, going nowhere – fast. This type of price action makes for bad trading in the near-term, but can result in a solid opportunity for those who are patient. A breakout is imminent at this point.
The unsustainable sideways path could go on for a bit longer, though, before we see a breakout develop, and this would actually be viewed as a good thing. Often times, the longer the sideways move the more explosive the eventual move is.
Which way will the range resolve? It could be in-line with the thrust off the yearly low, with the sideways price action acting as a bullish consolidation pattern. Or, it could be lower. It really isn’t worth trying to figure out right now.
On the top-side, a breakout above 12796 is needed to get things into gear. This would have the all-important 12950 level in focus, a level that dates to December 2019, with its most recent touch coming in December.
On the flip-side, if we see price breakdown develop there is good support in the 12650s, but the ultimate low of the congestion is at 12636. A breakdown would result in the June trend-line and confluent 200-day moving average quickly coming into play. It’s a big spot like 12950 is on the top-side.
We could see a fake-out breakout first before having a full resolution. That is, a break of either support or resistance followed by a quick reversal back inside the range and eventual breakout through the other side of the range. These can be even more powerful as the fake-break results in catching the crowd leaning the wrong way.
Whether we get a clean top or bottom side break or a fake-out breakout first, an opportunity is brewing in USD/CAD. With a little more time traders should be presented with a sustained move in either direction. We just may need to be patient for a little while longer.
USD/CAD Daily Chart

USD/CAD 4-hr Chart

Resources for Forex Traders
Whether you are a new or experienced trader, we have several resources available to help you; indicator for tracking trader sentiment, quarterly trading forecasts, analytical and educational webinars held daily, trading guides to help you improve trading performance, and one specifically for those who are new to forex.
---Written by Paul Robinson, Market Analyst
You can follow Paul on Twitter at @PaulRobinsonFX


