USD/CAD Technical Outlook
- USD/CAD trend since March remains lower
- Falling wedge may help it buck the trend
- Pattern is solid, but needs to confirm first
USD/CAD may soon buck the trend
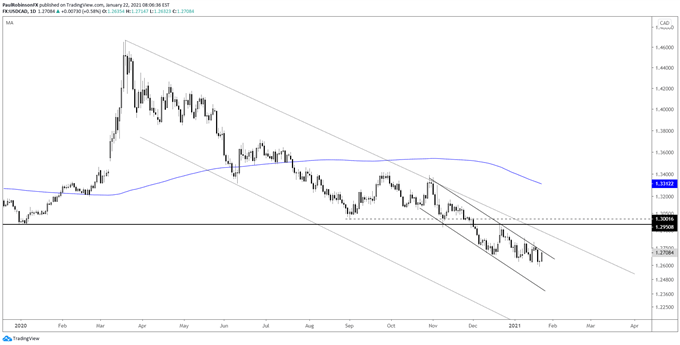
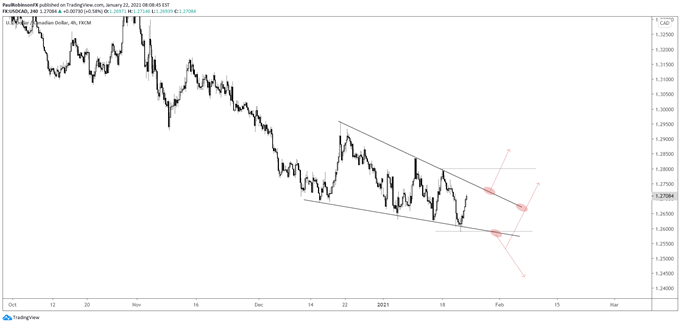
USD/CAD trending lower has been a theme since it peaked in dramatic fashion back in March, but the downtrend may be put to the test soon as a falling wedge pattern comes to light. These patterns can lead to powerful moves in the opposite direction as the one-way crowd gets caught leaning hard the wrong way.
But not always is this the case.
Sometimes the patterns lead to a trend continuation. The key here is to watch for confirmation before running too aggressively with a trading bias. For this thing to trigger a potential squeeze, the top-side line of the pattern (also a channel line from late October) needs to be broken.
In this scenario, the initial level of resistance to watch will be the trend-line running down from March, followed by the 130000 level that has been influential for some time now. That would certainly be an important test should the falling wedge resolve with a bullish outcome.
In the event the underside trend-line is breached, we may see USD/CAD fall apart and continue to trend lower towards the next level of support around 12529, a minor swing low created in 2018.
It is also possible we see a jab below the lower trend-line of the wedge then a reversal back through the top-side trend-line. These fake-out scenarios can also lead to powerful moves higher as the final push lower washes out remaining sellers.
In any event, what is key is how price action behaves once one of the converging lines is broken. If you would like to learn more, check out this piece on trading the falling wedge pattern, as well as our educational section discussing chart patterns.


USD/CAD Daily Chart (remains in clear downtrend)

USD/CAD 4-hr Chart (falling wedge may help it rise)

Resources for Forex Traders
Whether you are a new or experienced trader, we have several resources available to help you; indicator for tracking trader sentiment, quarterly trading forecasts, analytical and educational webinars held daily, trading guides to help you improve trading performance, and one specifically for those who are new to forex.
---Written by Paul Robinson, Market Analyst
You can follow Paul on Twitter at @PaulRobinsonFX


