


USD/CAD Technical Forecast
- Weaker US economy’s expectations weigh on the greenback
- USD vs CAD price resumed bearish price action
USD/CAD Price – Bears in Charge
Last week, USD/CAD hit a six-week low at 1.3351. However, the price rallied after as some bears seemed to cover. Ultimately, a weekly candlestick closed in the red with a 1.1% loss. Alongside that, the Relative Strength Index (RSI) fell from 44 to 39 reflecting stronger bearish momentum.
The rise in coronavirus cases in the US has affected the US growth expectations for the third quarter of this year and sent the US dollar lower against its peers.
USD/CAD DAILY PRICE CHART ( April 9, 2018 – July 28, 2020) Zoomed Out
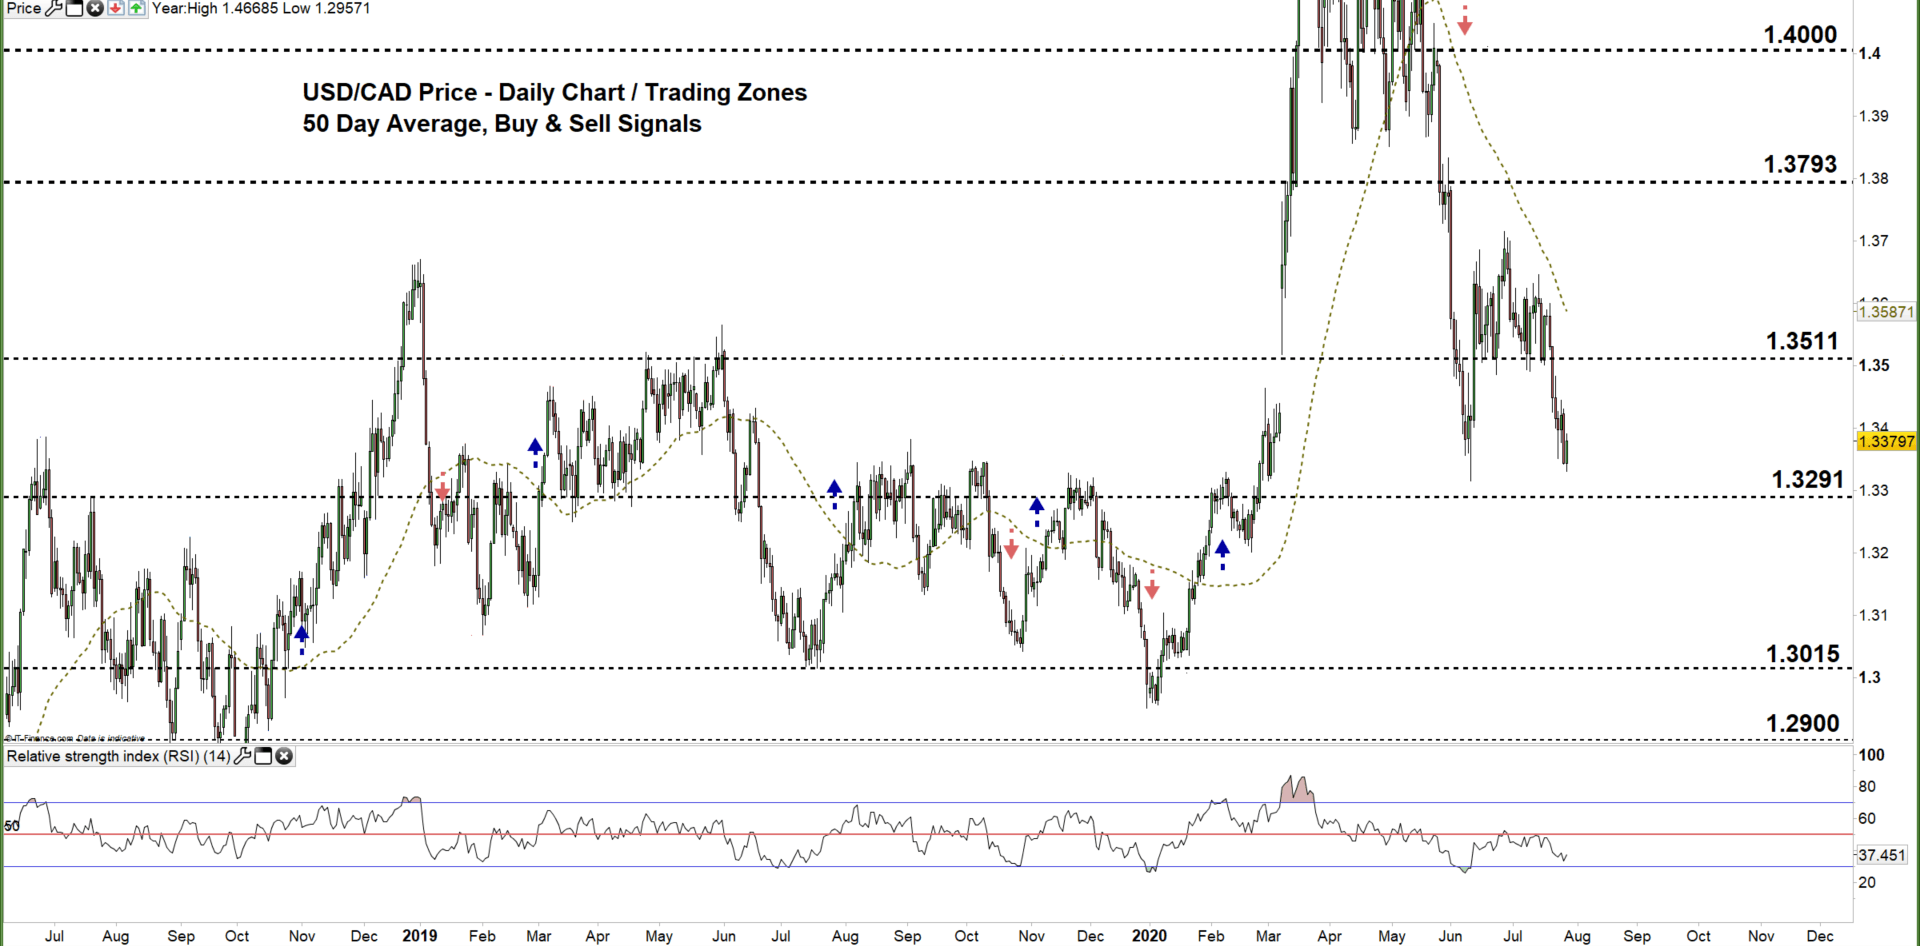

USD/CAD DAILY PRICE CHART (April 15 – JuLY 28, 2020) Zoomed In

In July 21, USD/CAD ended its sideways move and declined to the current 1.3511 -1.3291 trading zone indicating a shift in favor of bears to control.
A daily close below the low end of the current trading zone may encourage bears to press USDCAD towards the monthly support level at 1.3015 (around October 2008 high).
On the other hand, a failure in closing below the low end of the trading zone may cause a reversal towards the high end of the zone at 1.3511 ( around February 2016 low).

USD/CAD four hour PRICE CHART (June 10 – JuLY 28, 2020)

Last week, USD/CAD rebounded from the downward slopping trendline resistance originated from the July 20 high at 1.3600 indicating that bearish momentum was still intact.
To conclude, while the downward bias is still in place a break below the aforementioned downward trendline reflects a weaker bearish sentiment. Therefore a break above the July 24 high at 1.3445 may trigger a rally towards the high end of the current trading zone discussed above on the daily chart at 1.3511, while a break below 1.3264 could send USDCAD towards the 1.3200 mark. As such, the daily support and resistance levels marked on the four-hour chart should be monitored.
Written By: Mahmoud Alkudsi, Market Analyst
Please feel free to contact me on Twitter: @Malkudsi


