


USD/CAD Technical Forecast
- The haven-linked greenback weakened despite global increase in Covid-19 cases
- USD vs CAD price chart exposes a sideways move
USD/CAD Price – Reversed Lower
Last week, USD/CAD hit a two-week high of 1.3646 without committing to a new bull trend. Ultimately, the pair retreated and closed a weekly candlestick with a Doji pattern highlighting the market’s indecision. Alongside that, the Relative Strength Index (RSI) remained near 50 reflecting weak bears and weaker bulls.
The market invested in riskier assets amid positive news about a coronavirus vaccine. Despite rising cases of the coronavirus in the United States, market mood has remained upbeat, denting the haven-linked US Dollar.
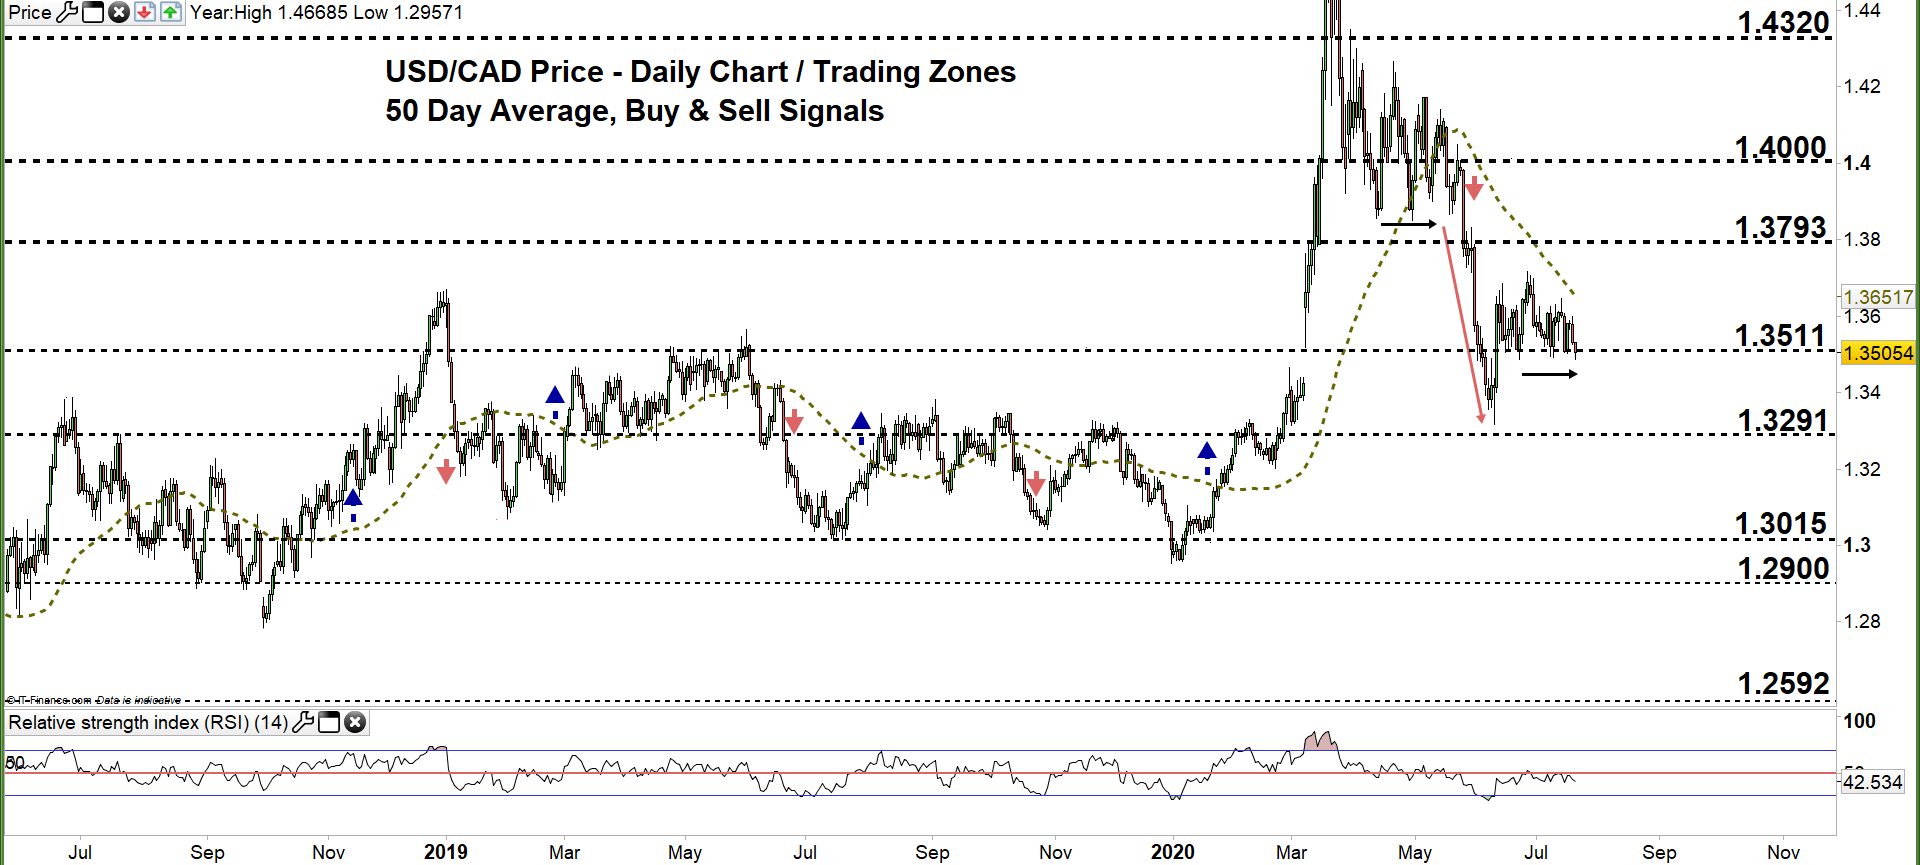
USD/CAD DAILY PRICE CHART ( APRIL 9, 2018 – JULY 21, 2020) Zoomed Out

USD/CAD DAILY PRICE CHART (APRIL 15 – JULY 21, 2020) Zoomed In

In Mid-June, USD/CAD pulled up from a multi-month slide and climbed to the current trading zone 1.3511- 1.3793. Since then, the price has failed on multiple occasions to break through the lower trading zone, repeatedly rebuffing efforts to put bears back in charge.
Another close above the low end of the current trading zone may open up a push behind USDCAD towards the high end of it, and a further close above that could encourage bulls to extend the rally towards1.4000 – a psychologically significant level.
On the other hand, a close below the low end of the zone may ultimately guide USDCAD’s fall towards 1.3291 which is a 200 point extension below the current range low, and any further breaks lower that level may embolden bears to revisit 1.3015 which is within range of 2020’s low.

USD/CAD FOUR HOUR PRICE CHART (JUNE 10 – JULY 21, 2020)
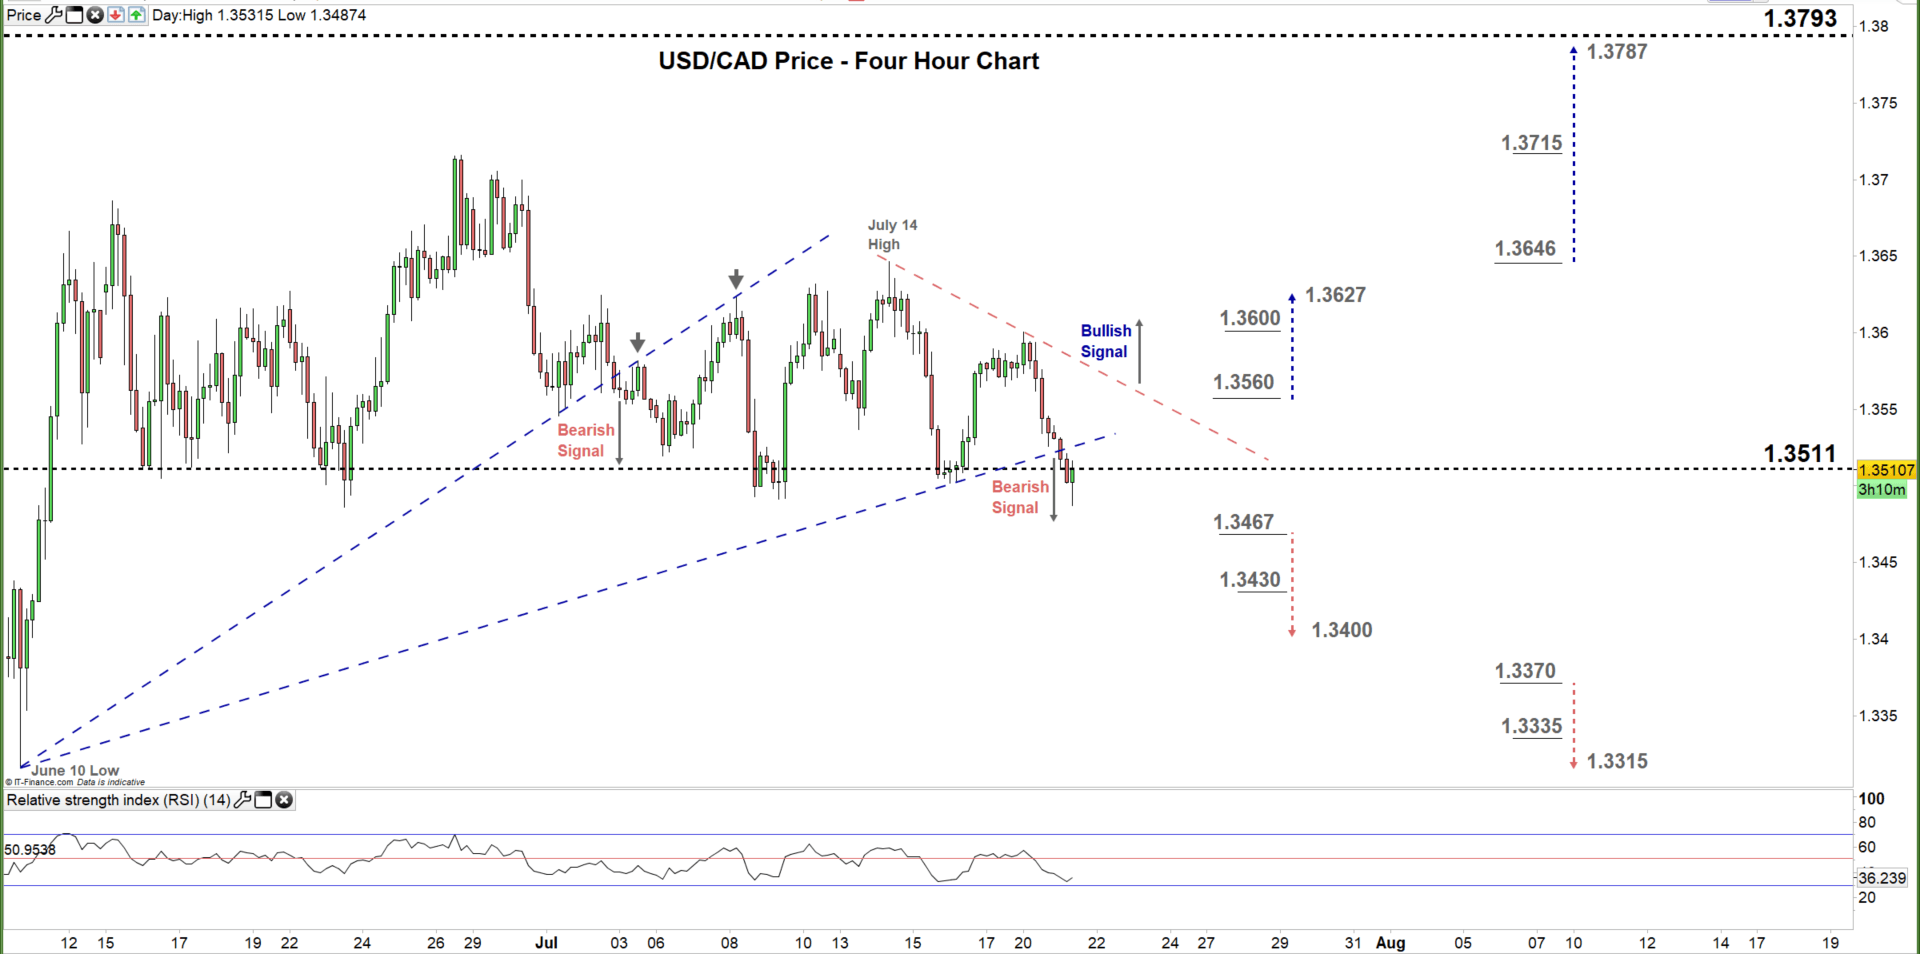
In early July, USD/CAD traded below the bullish trendline resistance originating from the June 10 low at 1.3315, a shift in favor of the bear’s to control, which has thus far held.
Yesterday, the pair produced another bearish signal after breaking below the second bullish trendline originating from the aforementioned June 10 low. With that said, a break above the downside slopping trendline resistance originating from the July 14 high at 1.3646, may keep the bullish potential alive.
To conclude, a break below 1.3467 could send USDCAD towards the 1.3400 handle, while a break above 1.3560 may trigger a rally towards 1.3627. As such, the weekly support and resistance levels underscored on the four-hour chart should be considered.
Written By: Mahmoud Alkudsi, Market Analyst
Please feel free to contact me on Twitter: @Malkudsi


