


USD/CAD Technical Forecast
USD/CAD Price – Indecisive Traders
On Monday, USD/CAD rallied to a two-week high at 1.3686 however, the price retreated after and closed the weekly candlestick with a Doji pattern signaling the market indecision at this stage.
Last week, the market slowed down US dollar selloff as the rising coronavirus cases in the US combined with reporting new cases in China weighed on the economic recovery expectations.
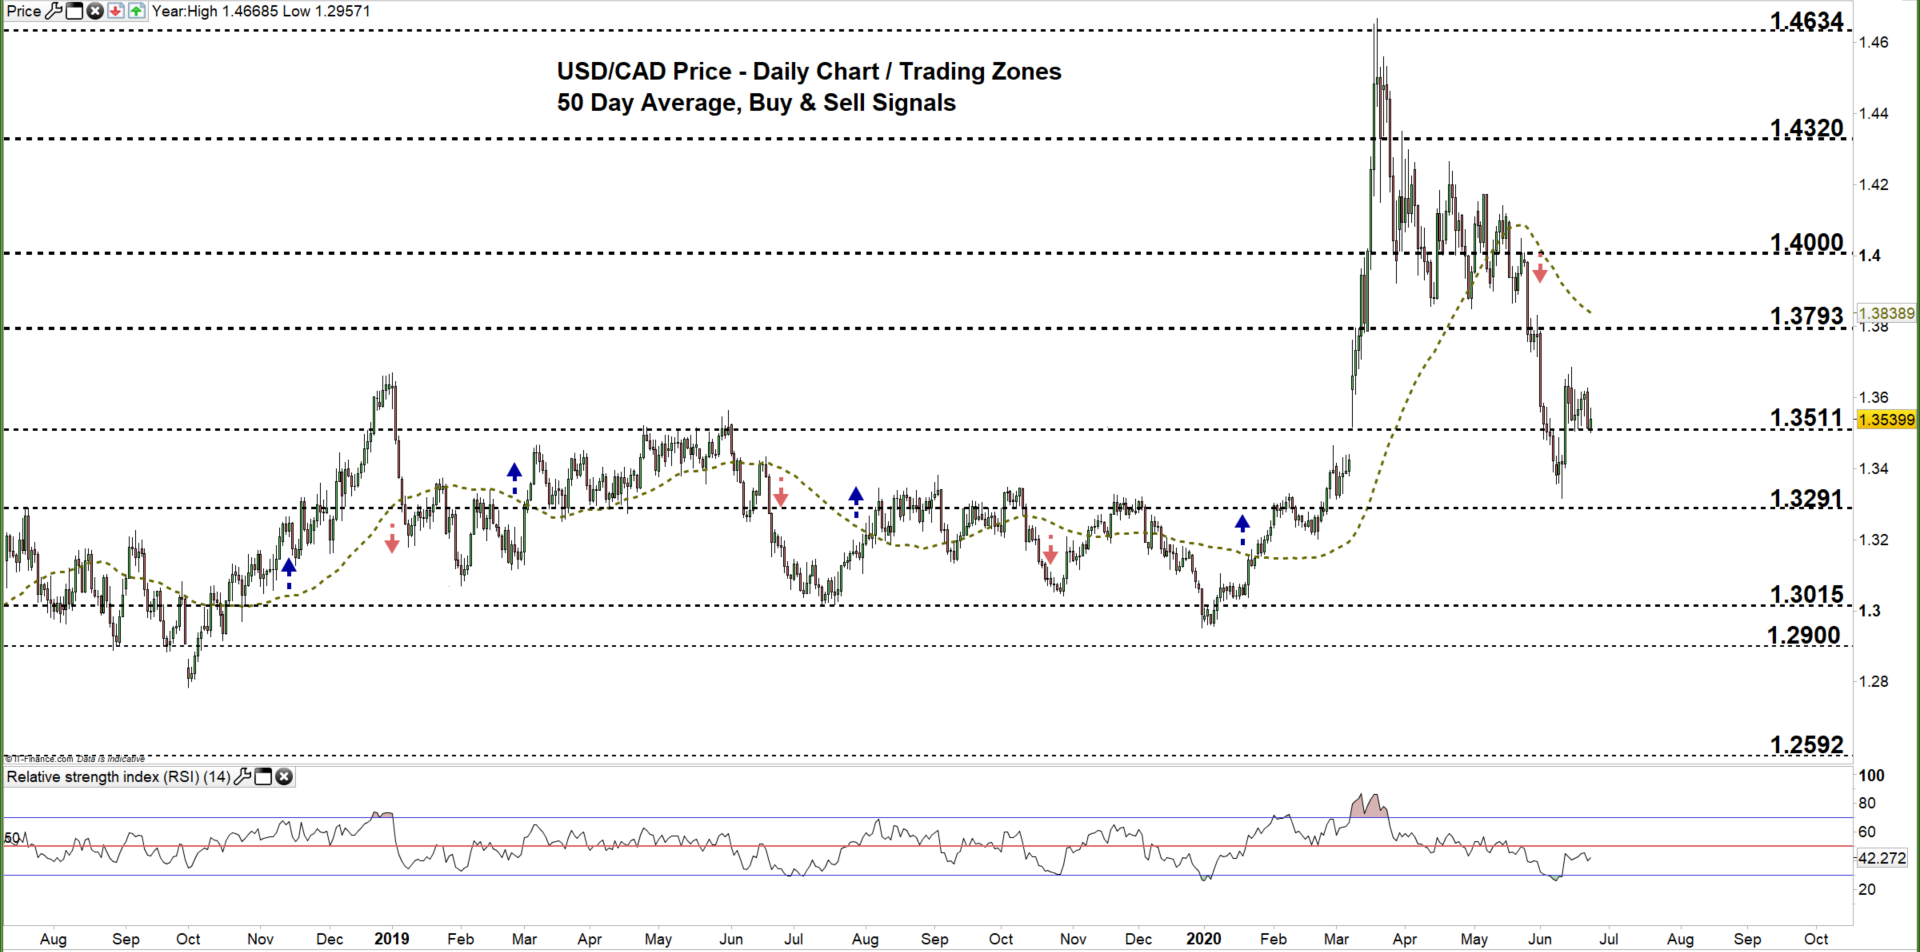
USD/CAD DAILY PRICE CHART (JuLY 28, 2018 – June 23, 2020) Zoomed Out

USD/CAD DAILY PRICE CHART (April 16 – June 23, 2020) Zoomed In

On June 11, USD/CAD climbed to the current trading zone 1.3291 – 1.3511 indicating that bears were losing momentum, and this led the price last week to correct its downward trend and create a higher low at 1.3504. Yesterday, the price failed to decline to the lower trading zone highlighting bears hesitation at this stage.
Any close below the low end of the aforementioned trading zone signals that bears could re-attempt pressing towards 1.3291. A Further close below this level may encourage bears to send USDCAD even lower towards 1.3015.
On the flip side, another failure in closing below the low end of the zone reflects the bear’s hesitation and may cause the price to rally towards the high end of the zone. A further close above that level could extend the rally towards the 1.4000 handle.

USD/CAD four hour PRICE CHART (May 22 – June 23, 2020)

On June 11, USD/CAD broke and remained above the downtrend line originated from the June 4 high at 1.3541 reflecting a weaker bearish sentiment.
Last week, the pair rebounded and consolidated above the low end of the trading zone discussed above reflecting weak bears and weaker bulls. Therefore, a break below this level would generate a bearish signal. On the other hand, any break above the downtrend line originated from the May 29 high at 1.3832 would generate a bullish signal.
To conclude, a break above 1.3686 may trigger a rally towards 1.3786 in turn, any break below 1.3378 could send USDCAD towards 1.3291. Nonetheless, the daily and support and resistance marked on the four-hour chart should be kept in focus.

Written By: Mahmoud Alkudsi, Market Analyst
Please feel free to contact me on Twitter: @Malkudsi


