


USD/CAD Technical Outlook
USD/CAD – Bearish Market
On Friday, USD/CAD declined to a near three-month low at 1.3714 then closed the weekly candlestick in the red with a 1.7% loss. Today, bears have led the price towards the 1.3500 handle.
Alongside this, the Relative Strength Index (RSI) fell from 40 to 27 reflecting the strength of bearish momentum.
USD/CAD DAILY PRICE CHART (AUG 17, 2018 – June 2, 2020) Zoomed Out
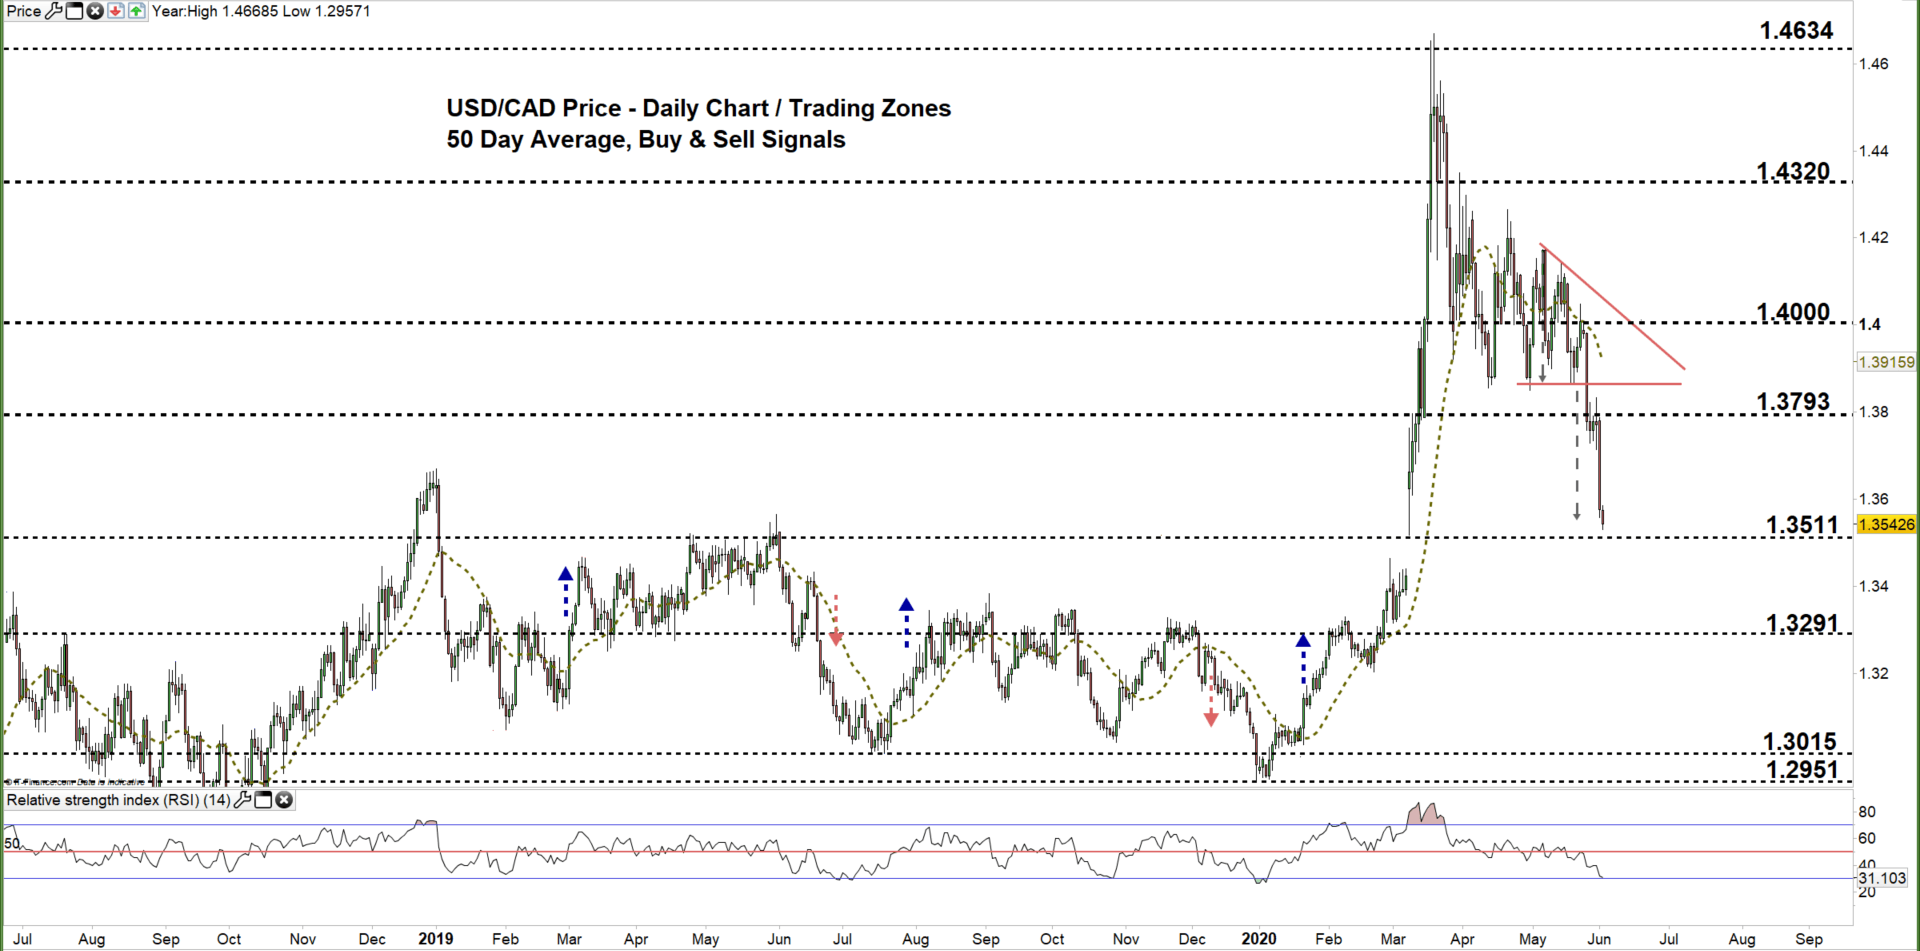

USD/CAD DAILY PRICE CHART (March 3 – June 2, 2020) Zoomed In

On May 22, USD/CAD failed to climb to the higher trading zone highlighting that bearish sentiment was still intact. On May 26, the pair broke below the lower line of the descending triangle and edged lower as expected in our last update.
Last week, the price showed even more weakness as it failed on multiple occasions to climb to the higher trading zone. Consequently, the pair has declined this week towards the low end of the current trading zone 1.3511- 1.3793.
A close below the low end of the aforementioned trading zone indicates that bears may press towards 1.3291. A further close below that level could send USDCAD even lower towards 1.3015. On the flip-side, any failure in closing below the low end of the zone reflects bears' hesitation and may lead some of them to exit the market causing a rally towards the high end of the zone. A further close above that level could extend the rally towards the 1.4000 handle.
That said, the weekly support and resistance levels underlined on the daily chart (zoomed in) should be monitored in both bullish/ bearish scenarios.

USD/CAD four hour PRICE CHART (April 13 – June 2, 2020)

On May 26, USD/CAD broke below the uptrend line originated from the May 20 low at 1.3868, and generated a bearish signal. Yesterday, the market violated the uptrend line originated from the May 27 low at 1.3728, and produced another bearish signal.
Thus, a break below 1.3426 signals a possible fall towards 1.3353. In turn, any break in the other direction i.e. above 1.3594 may trigger a rally towards 1.3725. Nonetheless, the daily and support and resistance marked on the four-hour chart should be kept in focus.

Written By: Mahmoud Alkudsi, Market Analyst
Please feel free to contact me on Twitter: @Malkudsi


