


USD/CAD Technical Outlook
USD/CAD – Slowing Downside Move
On May 19, USD/CAD rebounded from a near three weak low at 1.3866. Later on, the price rallied and recovered some of its losses. Yet, on Friday the market closed the weekly candlestick in the red with a 0.7% loss.
Alongside this, the Relative Strength Index (RSI) failed to cross above 50 indicating that the bearish momentum was still intact.
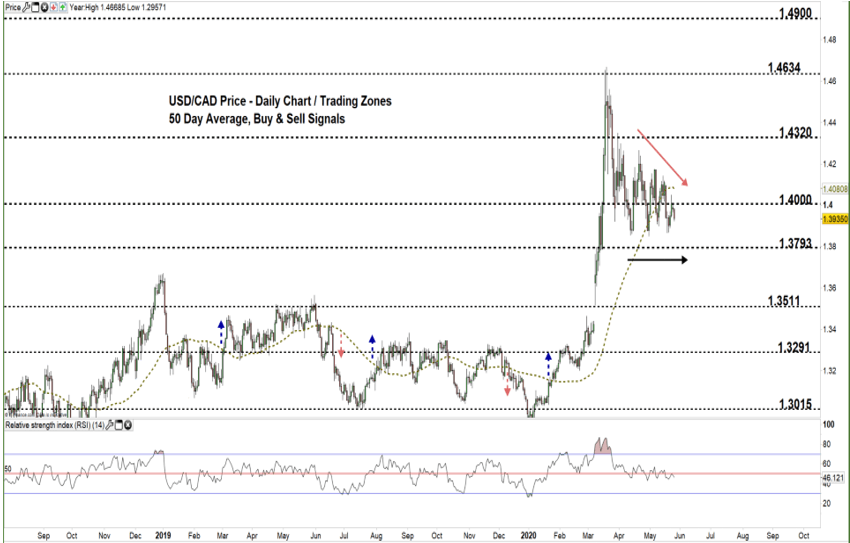
USD/CAD DAILY PRICE CHART (AUG 17, 2018 – May 26, 2020) Zoomed Out

USD/CAD DAILY PRICE CHART (March 3 – May 26, 2020) Zoomed In

Based on the analysis of the daily chart, in early April USD/CAD started a downtrend move creating a set of lower highs with lower lows. However, this month the market has paused this trend then formed a descending triangle.
On May 18, the price declined to the current trading zone 1.3793 – 1.4000 then closed below the 50-day moving average producing a bearish signal. Another bearish signal would be generated if USDCAD breaks and remains below the lower line of the descending triangle located at 1.3868.
A close below the low end of the aforementioned trading zone reflects a stronger bearish momentum and may send USDCAD towards 1.3511. A further close below that level could embolden bears to push towards 1.3291. In that scenario, the weekly support areas and levels marked on the chart (zoomed in) should be monitored.
In turn, a close above the high end of the zone signals bear’s hesitation. A further close above the upper line of the triangle and the 50-day moving average located today at 1.4085 may cause a rally towards 1.4320. That said, the weekly resistance levels underlined on the chart should be considered.

USD/CAD four hour PRICE CHART (April 13 – May 26, 2020)

Looking at the four- hour chart, on April 28 USD/CAD broke below the uptrend line originated from the April 13 low at 1.3856. Since then, the price has remained trading below this line highlighting the lack of impulse to start a bullish move. On Friday, the pair failed to overtake the downtrend line originated from the May 14 high at 1.4141, and generated a bearish signal.
A break below 1.3724 would produce an additional bearish signal and could send USDCAD towards the 1.3600 handle. Although, the weekly support level underscored on the chart should be kept in focus. On the other hand, a break above 1.4070 would generate a bullish signal and may trigger a rally towards 1.4154. Nonetheless, the weekly resistance level printed on the chart should be kept in focus.
See the chart to find out more about the key technical levels in a further bullish/bearish scenario.

Written By: Mahmoud Alkudsi, Market Analyst
Please feel free to contact me on Twitter: @Malkudsi


