


USD/CAD Price Technical Forecast
Multi Year High
On Thursday, USD/CAD tested its highest level in over four years at 1.4668. The price retreated after, as bulls seemed to cut back. Yet, on Friday the weekly candlestick closed in the green with 3.7% gain.
Alongside that, the Relative Strength Index (RSI) remained in overbought territory, emphasizing that bulls were in charge.
USD/CAD DAILY PRICE CHART (Nov 21, 2018 – Mar 24, 2020) Zoomed Out
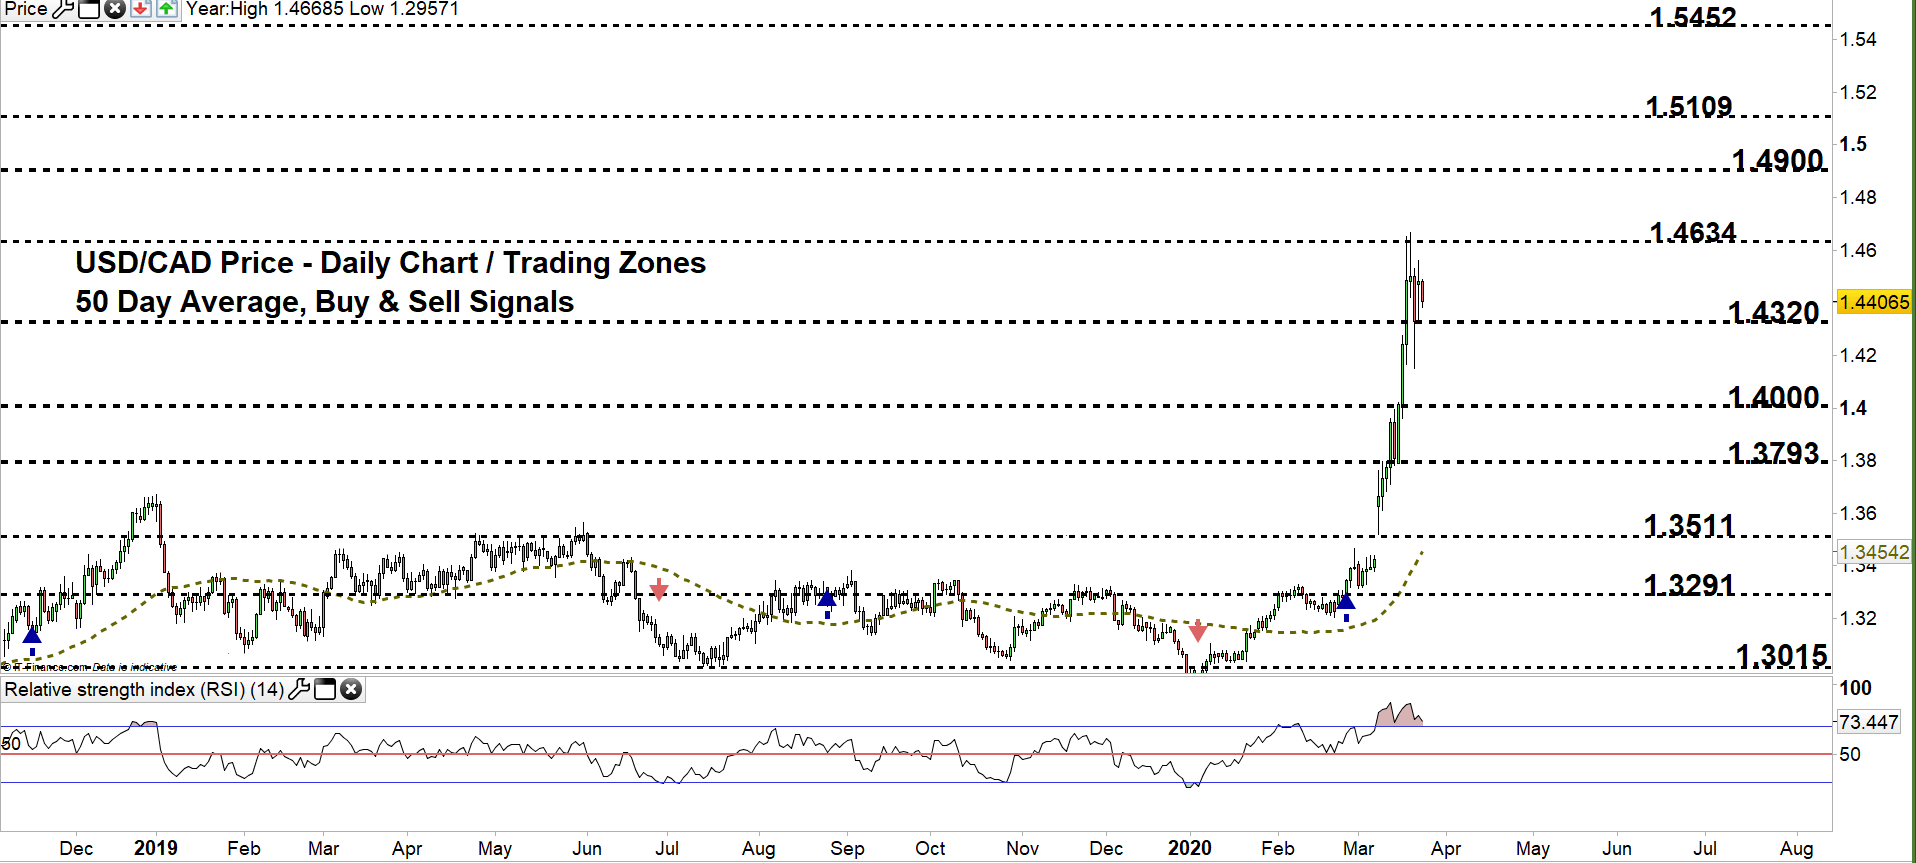

USD/CAD DAILY PRICE CHART (FEB 4 – Mar 24, 2020) Zoomed In

From the daily chart, we noticed that last week USD/CAD surged to current trading zone 1.4320 – 1.4634 then failed twice to rally further. The price fell after yet, remained in the same zone indicating that bulls were not done yet.
Thus, a close below the low end of the zone reflects hesitation from bull’s side. This could lead some of them to exit the market and cause USDCAD to decline towards 1.4000 handle. Further close below this level may send the price even lower towards 1.3793. That said, special attention should be paid to the daily support levels underscored on the chart (zoomed in) as some traders could exit/join the market around these points.
In turn, any failure in closing below the low end of the zone signals a possible bull’s comeback, as they may flip the pair’s direction towards the high end of the zone. Further close above this level could mean more bullishness towards 1.4900 handle. Nevertheless, the weekly resistance level marked in the chart should be kept in focus.

USD/CAD four hour PRICE CHART (Mar 9 – Mar 24, 2020)

Looking at the four- hour chart, we noticed that currently USD/CAD trades above the uptrend line originated from the March 16 low at 1.3787. Any violation to this line would be considered as bearish signal. Another bearish signal would be generated if the price falls below the neckline of double top pattern (reversal pattern) located at 1.4150. In that scenario, the pair could decline towards 1.3670.
A break below 1.4272 might send USDCAD towards 1.4176. Although, the daily support level underlined on the chart should be considered. On the other hand, any break above the second top of the aforementioned double top pattern residing at 1.4560 would negate this formation and may cause a rally towards the high end of current trading zone discussed above on the daily chart. Having said that, the daily resistance level printed on the chart should be watched closely.
See the chart to find out more about key levels to monitor in a further bullish/bearish move.

Written By: Mahmoud Alkudsi
Please feel free to contact me on Twitter: @Malkudsi


