


USD/CAD Price Technical Outlook
USD/CAD – Multi Month High
Yesterday, USD/CAD rallied to 1.3329- its highest level in four months. However, the market retreated today as some bulls seemed to cut back.
The Relative Strength Index (RSI) rose twice above 70 then dipped below highlighting a top failure swing and signaling that uptrend move could end soon.
USD/CAD DAILY PRICE CHART (MAR 25, 2018 – FEB 11, 2020) Zoomed Out
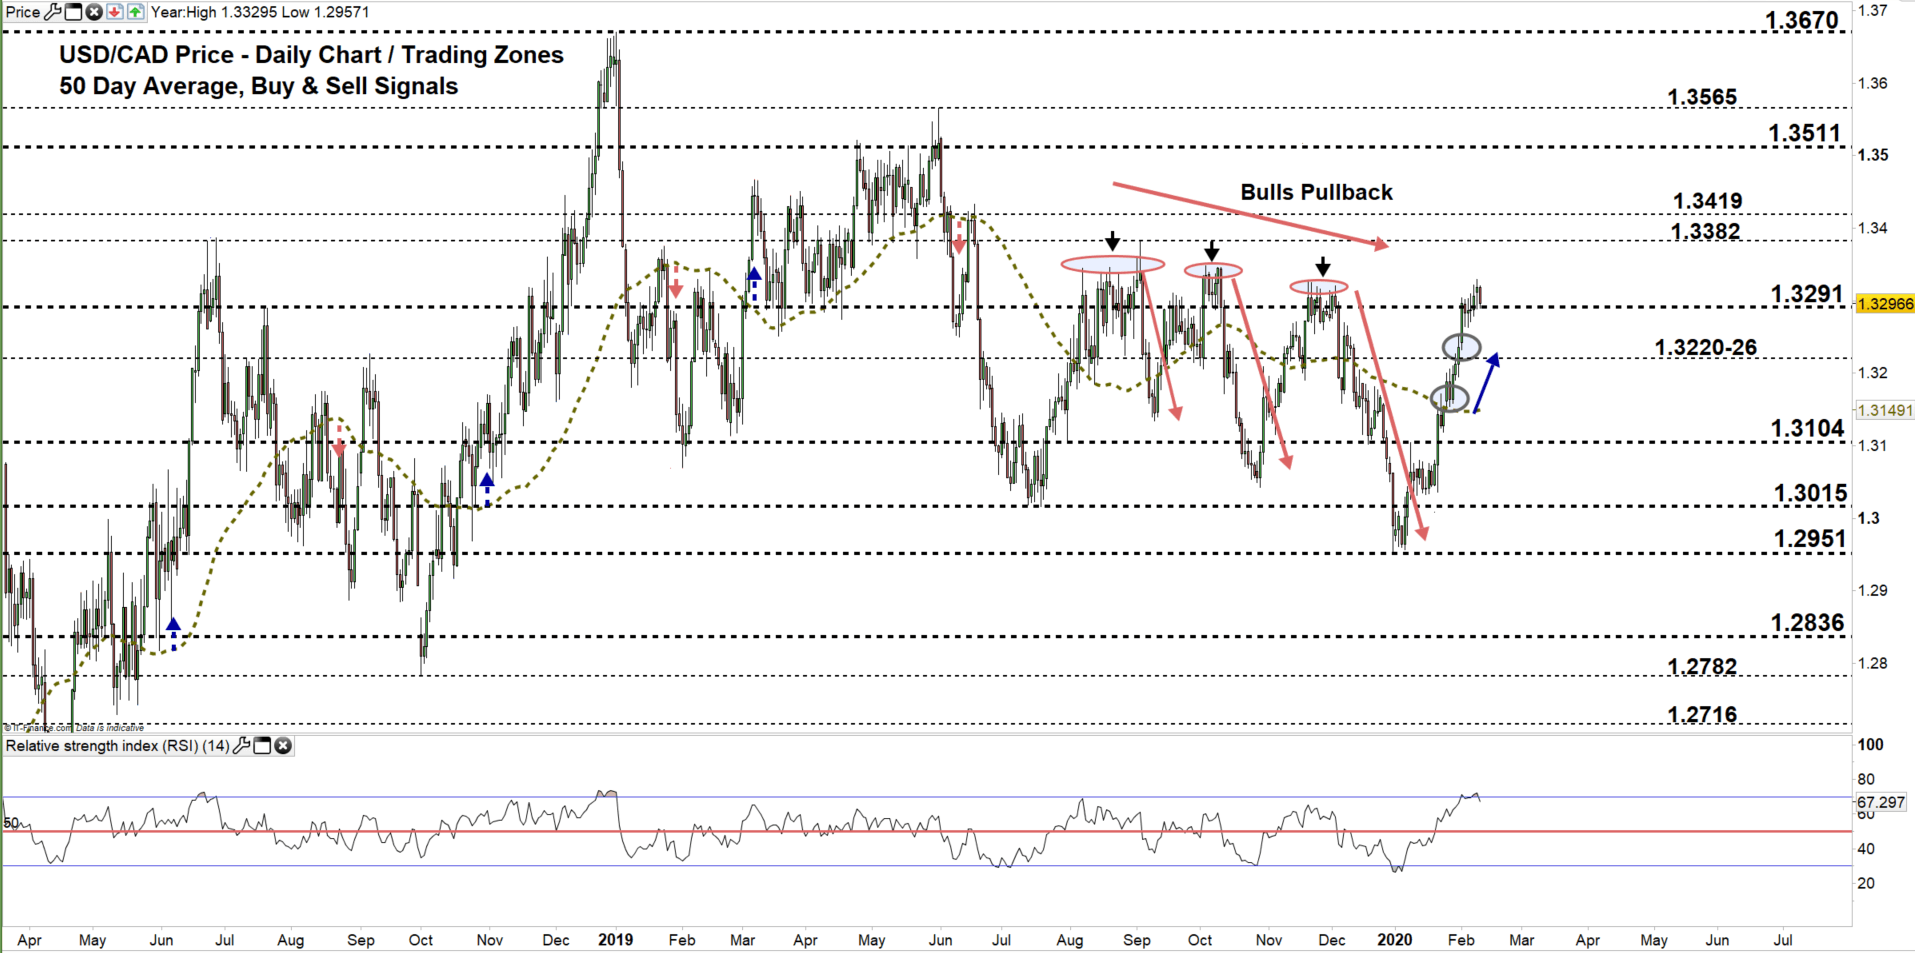

USD/CAD DAILY PRICE CHART (SEp 6 - FEB 11, 2020) Zoomed In

From the daily chart, we noticed that since early Aug last year USD/CAD bulls failed in multiple occasions to break above 1.3382. Every time they failed the price has been declining further, see the chart (zoomed out).
Zooming in the chart we noticed that USDCAD repeated the same scenario i.e. double top pattern with a break below the neckline then a fall to a new low. Last week, bulls showed hesitation again in the same trading zone 1.3291 – 1.3382. This week, the market opened with another gap to the upside (exhaustion gap) indicating that bulls could be preparing for another pullback.
Therefore, a close below the low end of the zone could lead some bulls to pullback causing a fall towards the daily support level marked on the chart (zoomed in) and possibly a test of the low end of the zone.
On the other hand, a close above the high end of the zone may embolden bulls to push towards 1.3419. Further close above this might cause more bullishness towards 1. 3511.Yet, the weekly resistance area and levels printed on the chart should be considered.

USD/CAD four hour PRICE CHART (Jan 6 – FEB 11, 2020)

Looking at the four- hour chart, we notice that on Jan 22 USD/CAD resumed bullish price action .On Feb 3, the pair rallied above 1.3300 handle for the first time in two months. Currently, the price eyes a test of the uptrend line originated form the FEB 5 low at 1.3263. Any violation of this line could be considered as a bearish signal.
Thus, a break below the Feb 5 low mentioned above may send USDCAD towards 1.3226. Nevertheless, the daily support level underlined on the chart should be kept in focus. On the flip-side, a break above 1.3396 might cause a rally towards 1.3419.
See the chart to figure out more about key levels to monitor in a further bullish/bearish move.
Written By: Mahmoud Alkudsi
Please feel free to contact me on Twitter: @Malkudsi


