


US Dollar vs Canadian Dollar Price Forecast
- USD/CAD chart exposes pausing downtrend move
- Levels and thresholds to consider
Last week, USD/CAD traded in a trendless move as every candlestick reversed the effect of the one before. The weekly candlestick closed with a Doji pattern reflecting market’s indecision at this stage.
Alongside that, the Relative Strength Index (RSI) abandoned oversold territory. However, the oscillator remained flat below 50 indicating highlighting that downtrend move was still intact.
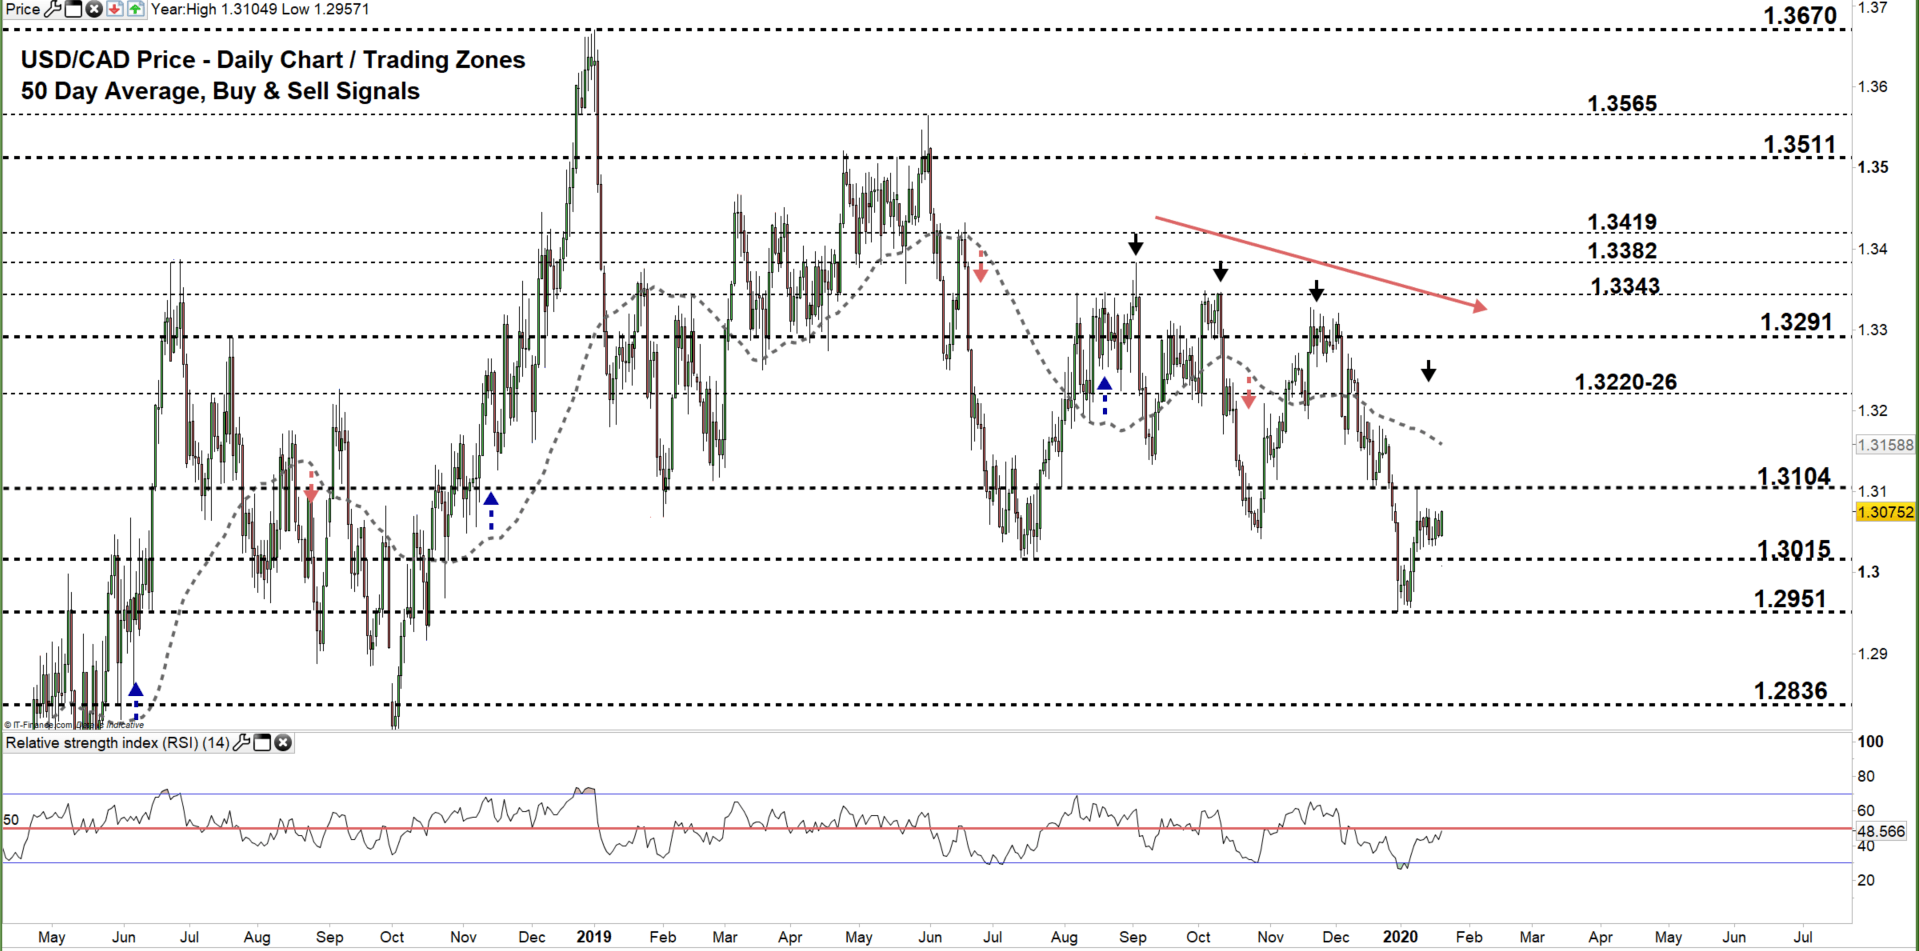
USD/CAD DAILY PRICE CHART (April 5, 2018 – Jan 15, 2020) Zoomed Out

USD/CAD DAILY PRICE CHART (OCT 11– Jan 21, 2020) Zoomed In
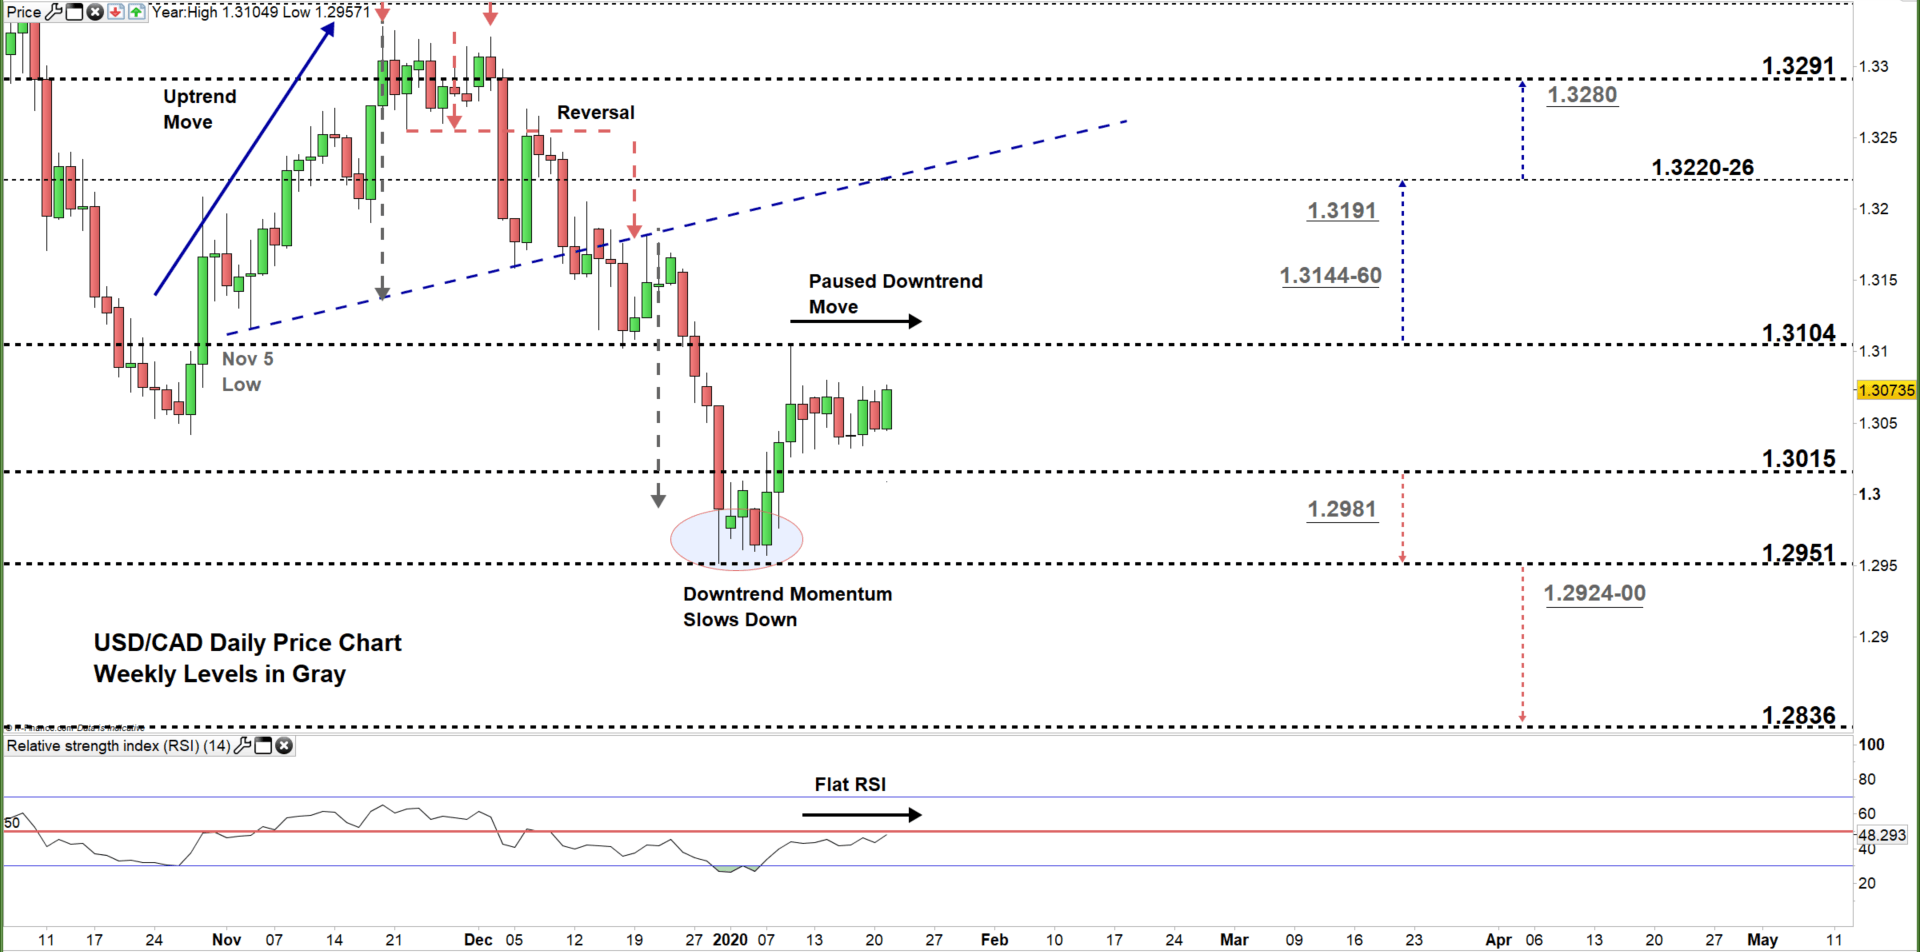
From the daily chart, we notice on Dec 4 USD/CAD reversed its uptrend move and broke below the neckline of double top pattern located at 1.3254. On Dec 12, the pair broke below the uptrend line originated from the Nov 5 low at 1.3154 and generated another bearish signal.
This led the pair to print on Dec 31 its lowest level in over fourteen months at 1.2951. Later, the price rallied as USD/CAD bears eased up then rebounded from the high end of current trading zone 1.3015 – 1.3104.
A close below the low end of the zone could send the price towards the aforementioned Dec 31 low. Further close below this level opens the door for USD/CAD bears to press towards 1.2836. Special attention should be paid to the weekly support level and area marked on the chart (zoomed in) as some traders may join/exit the market around these points.
In turn, any close above the high end of the zone might cause more easing from bears and paves the way for USDCAD bulls to push towards the vicinity of 1.3220-26. Nevertheless, the weekly resistance area and level underscored on the chart should be considered.

USD/CAD four hour PRICE CHART (DEc 30 – Jan 21, 2020)
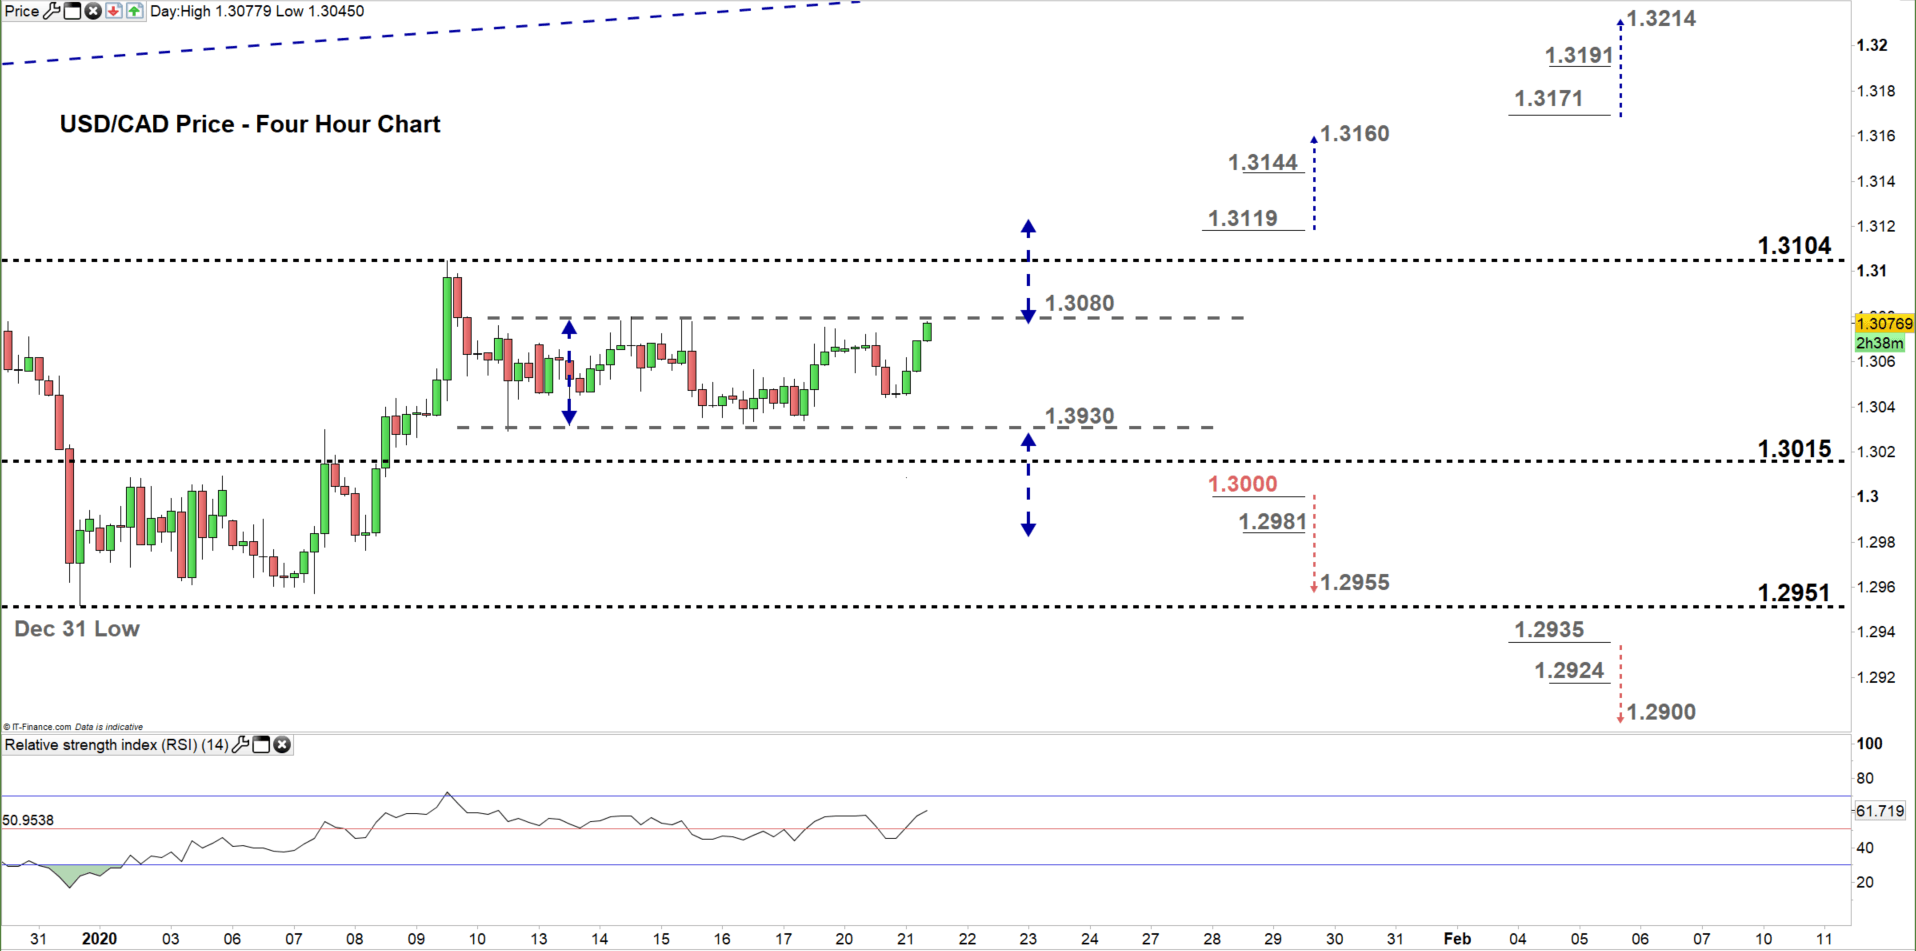
Looking at the four- hour chart, we notice on Jan 9 USD/CAD rebounded from the high end of the trading zone discussed above on the daily chart, then stuck in a narrow range (nearly 50 pips) creating higher lows with lower highs. The price needs to break above/ below this range (see the chart) to move in a clear direction.
Thus, a break above 1.3119 may push USDCAD towards 1.3160. That said, the weekly resistance level underscored on the chart should be kept in focus. On the flip -side, a break below 1.3000 handle could lead the price towards 1.2955. Although, the weekly support level underscored on the chart should be watched closely.
See the chart to figure out more about key levels to monitor in a further bullish/bearish move.
Written By: Mahmoud Alkudsi
Please feel free to contact me on Twitter: @Malkudsi


