


CANADIAN DOLLAR FORECAST: USD/CAD PRICE ACTION BOUNCES OFF TECHNICAL SUPPORT AS CRUDE OIL PIVOTS LOWER
- The Canadian Dollar is slipping alongside crude oil prices owing largely to the recent lull in geopolitical tension across the Middle East
- USD/CAD pivoted higher off a major technical support level underpinned by the 1.3000 handle and spot prices could have more room to run
- CAD price action is primed for heightened currency volatility ahead of the monthly jobs report on deck for release Friday, January 10 at 13:30 GMT
The Canadian Dollar was the best performing major currency pair last year with the trend initially looking set to continue into early 2020. CAD price action is now coming under pressure, however, as recent upside in the Loonie unwinds alongside crude oil.
CANADIAN DOLLAR INDEX & CRUDE OIL PRICE CHART: DAILY TIME FRAME (JULY 2019 TO JANUARY 2020)
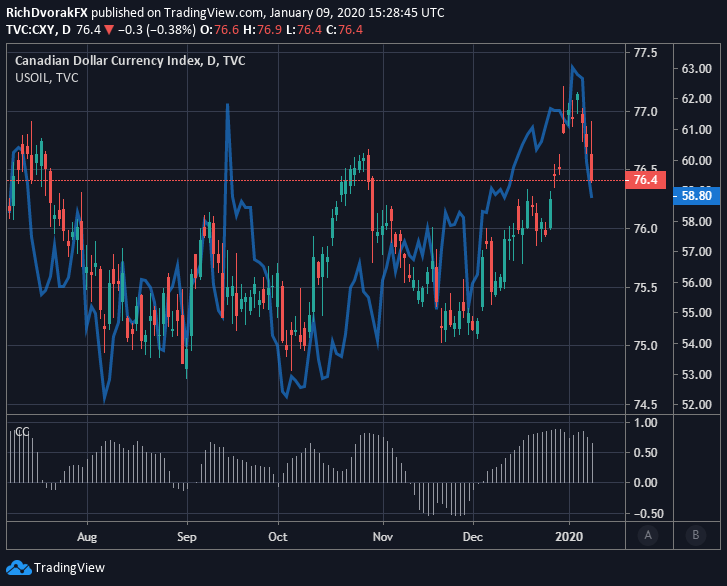
Chart created by @RichDvorakFX with TradingView
Spot CAD could face additional downside if the selloff in oil is sustained in light of the strong positive correlation between CAD and oil. This scenario may warrant greater credence with the lack of another flareup in tension between the US and Iran following a speech from President Trump, which exposed a lack of appetite for further military escalation.
USD/CAD PRICE CHART: WEEKLY TIME FRAME (JUNE 2018 TO JANUARY 2020)
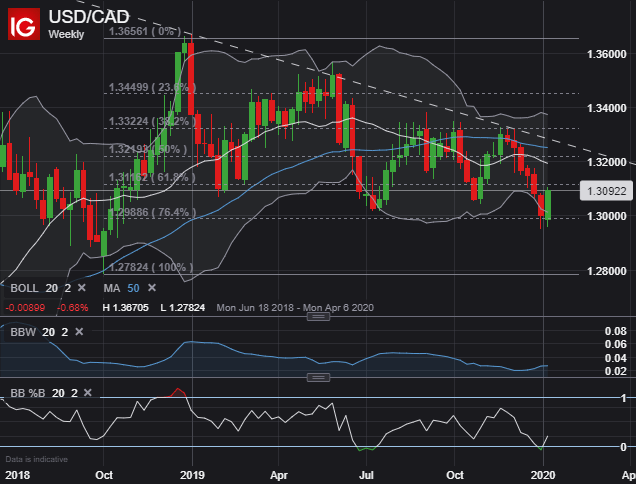
Though USD/CAD price action has already spiked higher after finding technical support around the 1.3000 level, the Canadian Dollar is retreating from its strongest level since October 2018.
This zone of confluent support is underpinned by the 76.4% Fibonacci retracement of the near-vertical ascent in spot USD/CAD prices from the October 2018 swing low to January 2019 swing high.
Meanwhile, a weekly USD/CAD chart reveals that spot prices seem to be finding buoyancy from its 2-standard deviation Bollinger Band.
USD/CAD PRICE CHART: DAILY TIME FRAME (OCTOBER 2019 TO JANUARY 2020)

A daily chart of the Canadian Dollar suggests that the latest bit of weakness in the Loonie – and resulting strength in USD/CAD – has potential to continue. Nevertheless, nearside technical resistance resides around the 1.3070-1.3080 area.
This level is roughly underpinned by the 20-day simple moving average and downward-sloping trendline extended through the December 03 and December 23 intraday highs. Beyond this initial technical barrier, the 1.3100 mark comes into focus and is highlighted by the Canadian Dollar’s rally run against the Greenback throughout December.
| Change in | Longs | Shorts | OI |
| Daily | 6% | -11% | -5% |
| Weekly | 12% | -18% | -8% |
Topping this level of resistance could open up the door for USD/CAD bulls to subsequently target its 50-DMA and 200-DMA. Moreover, positive divergence on the MACD as upward momentum gains traction and the RSI rising out of ‘oversold territory’ both provide encouraging signs for potentially higher spot USD/CAD prices.
CANADIAN LABOUR FORCE SURVEY – MONTHLY CHANGE IN EMPLOYMENT & UNEMPLOYMENT RATE
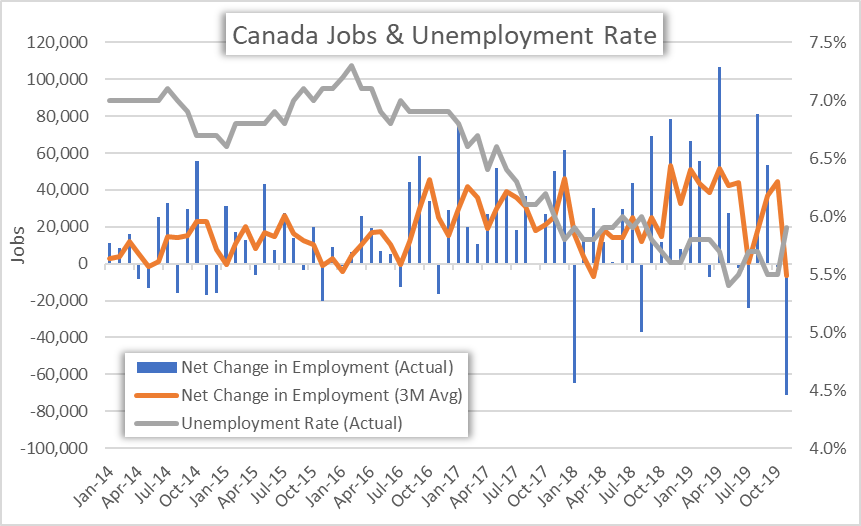
Nevertheless, the Canadian Dollar will likely respond predominantly to the monthly jobs report slated to cross the wires Friday, January 10 at 13:30 GMT. The Canadian Dollar was crushed on weak employment data published last month that detailed a shocking -71,000 decline in jobs for the November 2019 reporting period.
Read More – Will the Bank of Canada (BOC) Capitulate and Join the Doves?
Further evidence of deterioration in the Canadian jobs market could seriously jeopardize CAD prices if traders subsequently inflate Bank of Canada interest rate cut expectations in response. There is currently 20-basis points worth of BOC interest rate cuts expected by the central bank’s October 28 monetary policy update according to the latest overnight swaps pricing.
CHART OF CANADIAN DOLLAR RISK REVERSALS & SPOT USD/CAD

That said, forex option traders appear to have a bullish bias regarding the direction of spot USD/CAD price action judging by Canadian Dollar risk reversals across the overnight, 1-week and 1-month tenors. A risk reversal reading above zero indicates that the demand for call option volatility (upside protection) exceeds that of put option volatility (downside protection).
-- Written by Rich Dvorak, Junior Analyst for DailyFX.com
Connect with @RichDvorakFX on Twitter for real-time market insight


