


Canadian Dollar Technical analysis
- USD/CAD analysis and chart
- Canadian Dollar price action against US Dollar

USD/CAD – Paused Downtrend
Last week, USD/CAD closed the weekly candlestick in the red with 0.6% loss. Yesterday, the price declined to 1.3115 – its lowest level in six weeks. The price rallied after as sellers took profit.
Alongside that, the Relative Strength Index (RSI) crossed below 50 then remained flat after indicating to hesitant sellers in a bearish market.
Just getting started? See our Beginners’ Guide for FX traders
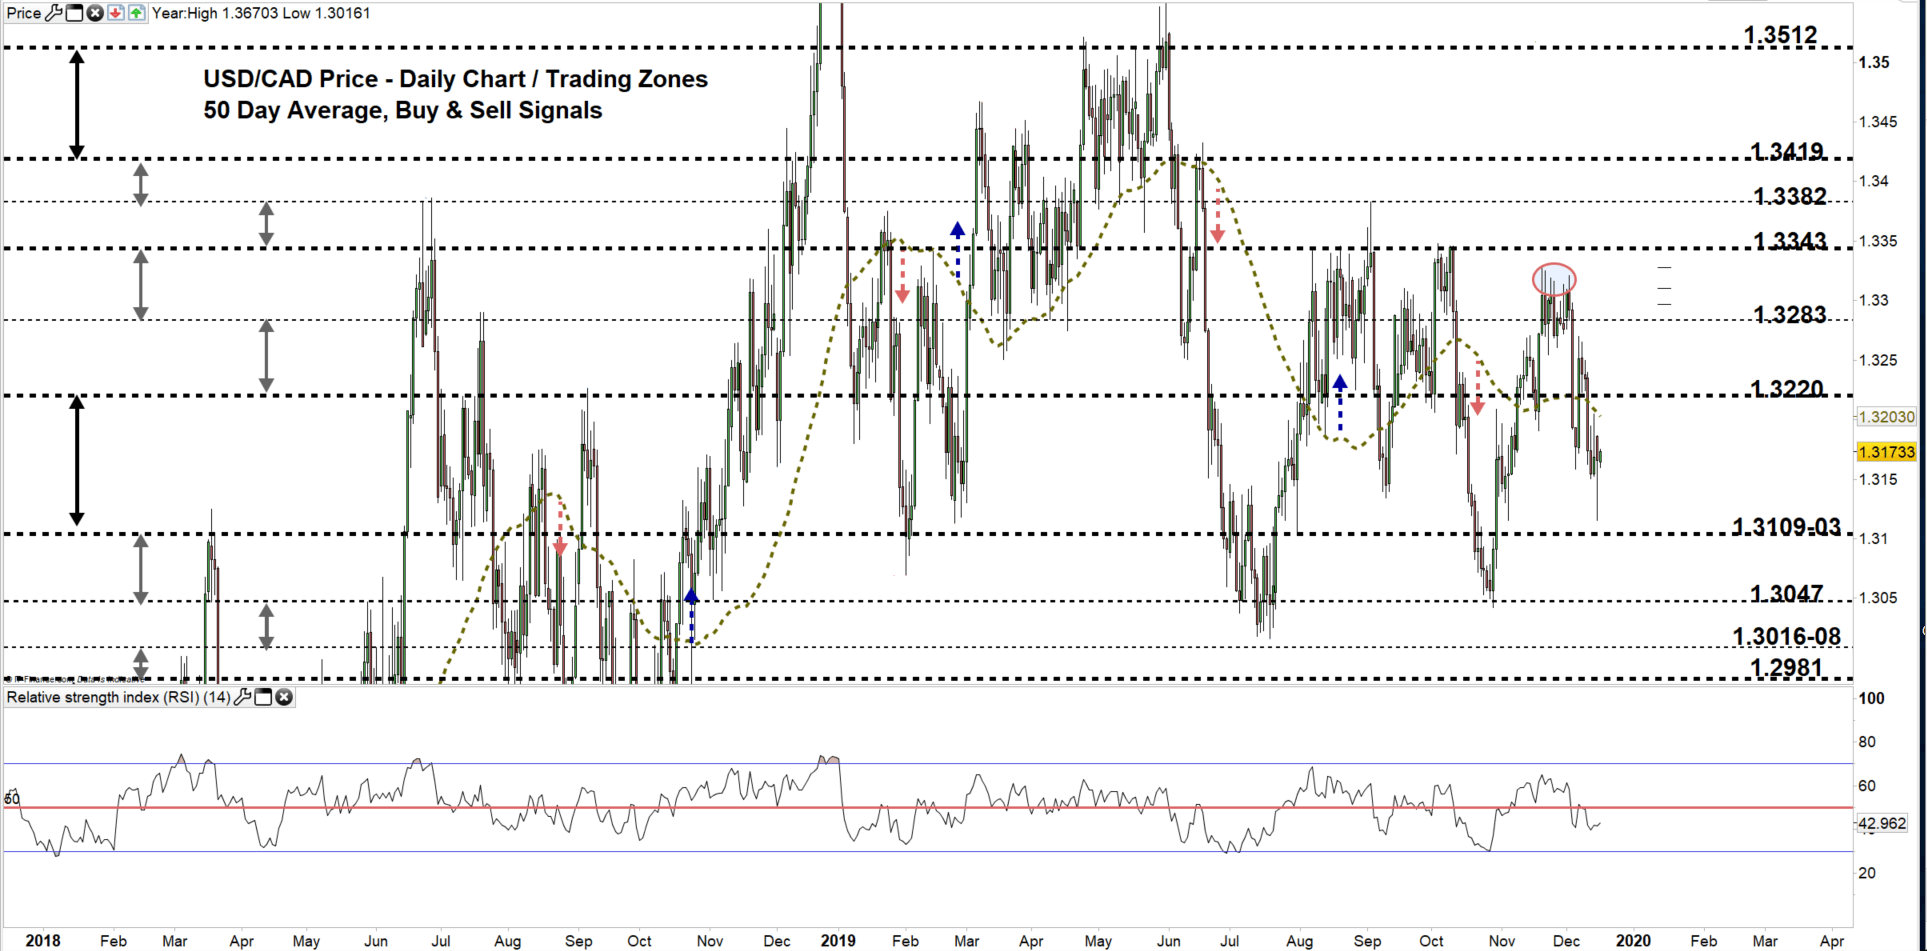
USD/CAD DAILY PRICE CHART (Jan 5, 2018 – DEC 17, 2019) Zoomed Out
USD/CAD DAILY PRICE CHART (JuLY 17– DEC 17, 2019) Zoomed In

From the daily chart, we notice on Wednesday, USD/CAD declined to a lower trading zone 1.3109 – 1.3220 then closed below the 50-day average generating two bearish signals.
Sellers could keep pressing towards the low end of the zone. A close below the low end, could encourage market participants to send USDCAD towards the monthly support located nearby the vicinity of 1.3047-42. Nevertheless, a special attention needs to be paid to the weekly support levels marked on the chart (zoomed in) as some sellers could exit the market at these points.
On the other hand, any close above 1.3226 would mean clear hesitation from sellers. This paves the way for buyers to push towards 1.3280-83. In that scenario, the weekly resistance level underscored on the chart should be monitored.

USD/CAD four hour PRICE CHART (July 17 – DEC 17, 2019)
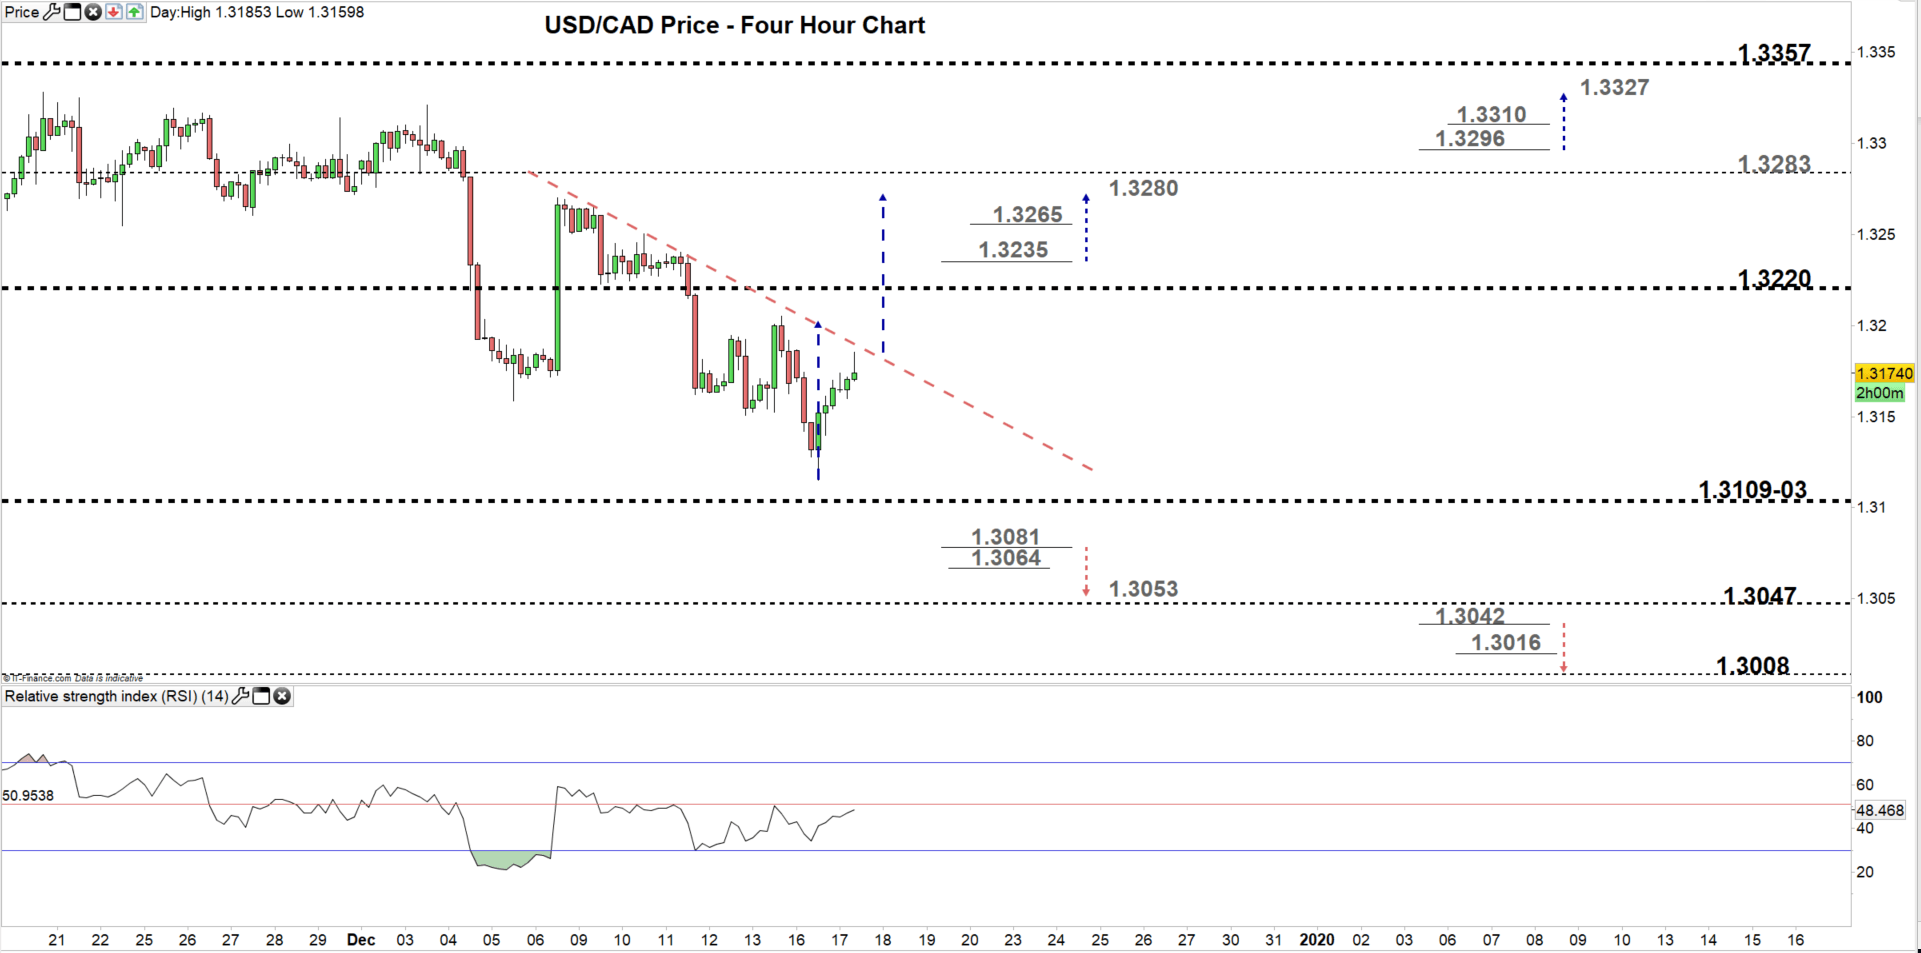
Looking at the four- hour chart, we notice on Dec 6 USD/CAD resumed bearish price action creating lower highs with lower lows. Currently, the price eyes a test of the downtrend line originated from the Dec 9 high at 1.3265.
Therefore, a break above 1.3235 could cause a rally towards 1.3280. Although, the weekly resistance level underlined on the chart should be kept in focus. On the other hand, a break below 1.3081 could press USDCAD towards 1.3053. Yet, the weekly support level underscored on the chart should be considered.
See the chart to know more about key levels to monitor in a further bullish/bearish move.
Having trouble with your trading strategy? Here’s the #1 Mistake That Traders Make
Written By: Mahmoud Alkudsi
Please feel free to contact me on Twitter: @Malkudsi


