


Canadian Dollar Outlook
- USD/CAD charts and analysis
- Canadian Dollar price action against US Dollar
Check our latest Q4 forecasts for free and learn what is likely to move the markets at this time of the year.
USD/CAD – Stalled Rally
On Nov 14, USD/CAD rallied towards 1.3270- its highest level in five weeks. However, the price slipped after, then closed the weekly candlestick with a bearish Doji pattern, highlighting buyer’s hesitation at this stage.
Last week, the Relative Strength Index (RSI) remained flat above 50, indicating to a paused uptrend momentum. This week the oscillator dropped from 60 to 52 emphasizing less buyers in the market.
Just getting started? See our Beginners’ Guide for FX traders
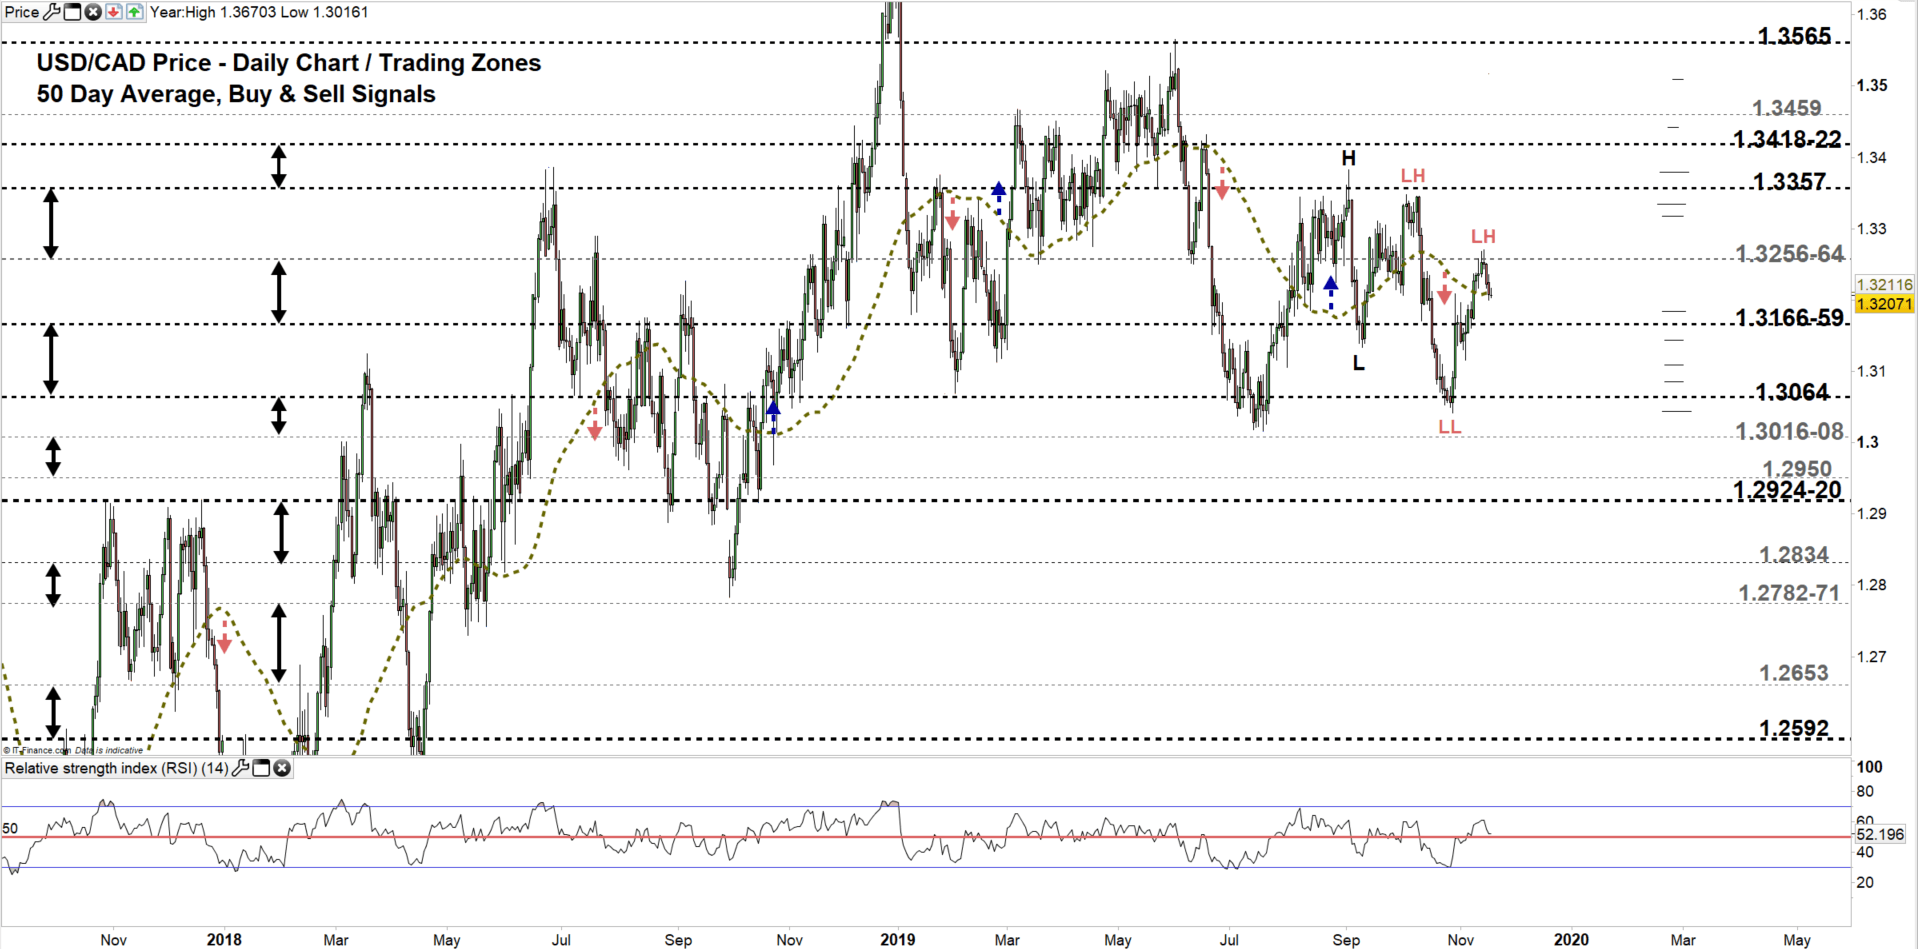
USD/CAD DAILY PRICE CHART (AUg 15, 2017 – Nov 19, 2019) Zoomed Out
USD/CAD DAILY PRICE CHART (June 10– Nov 19, 2019) Zoomed In
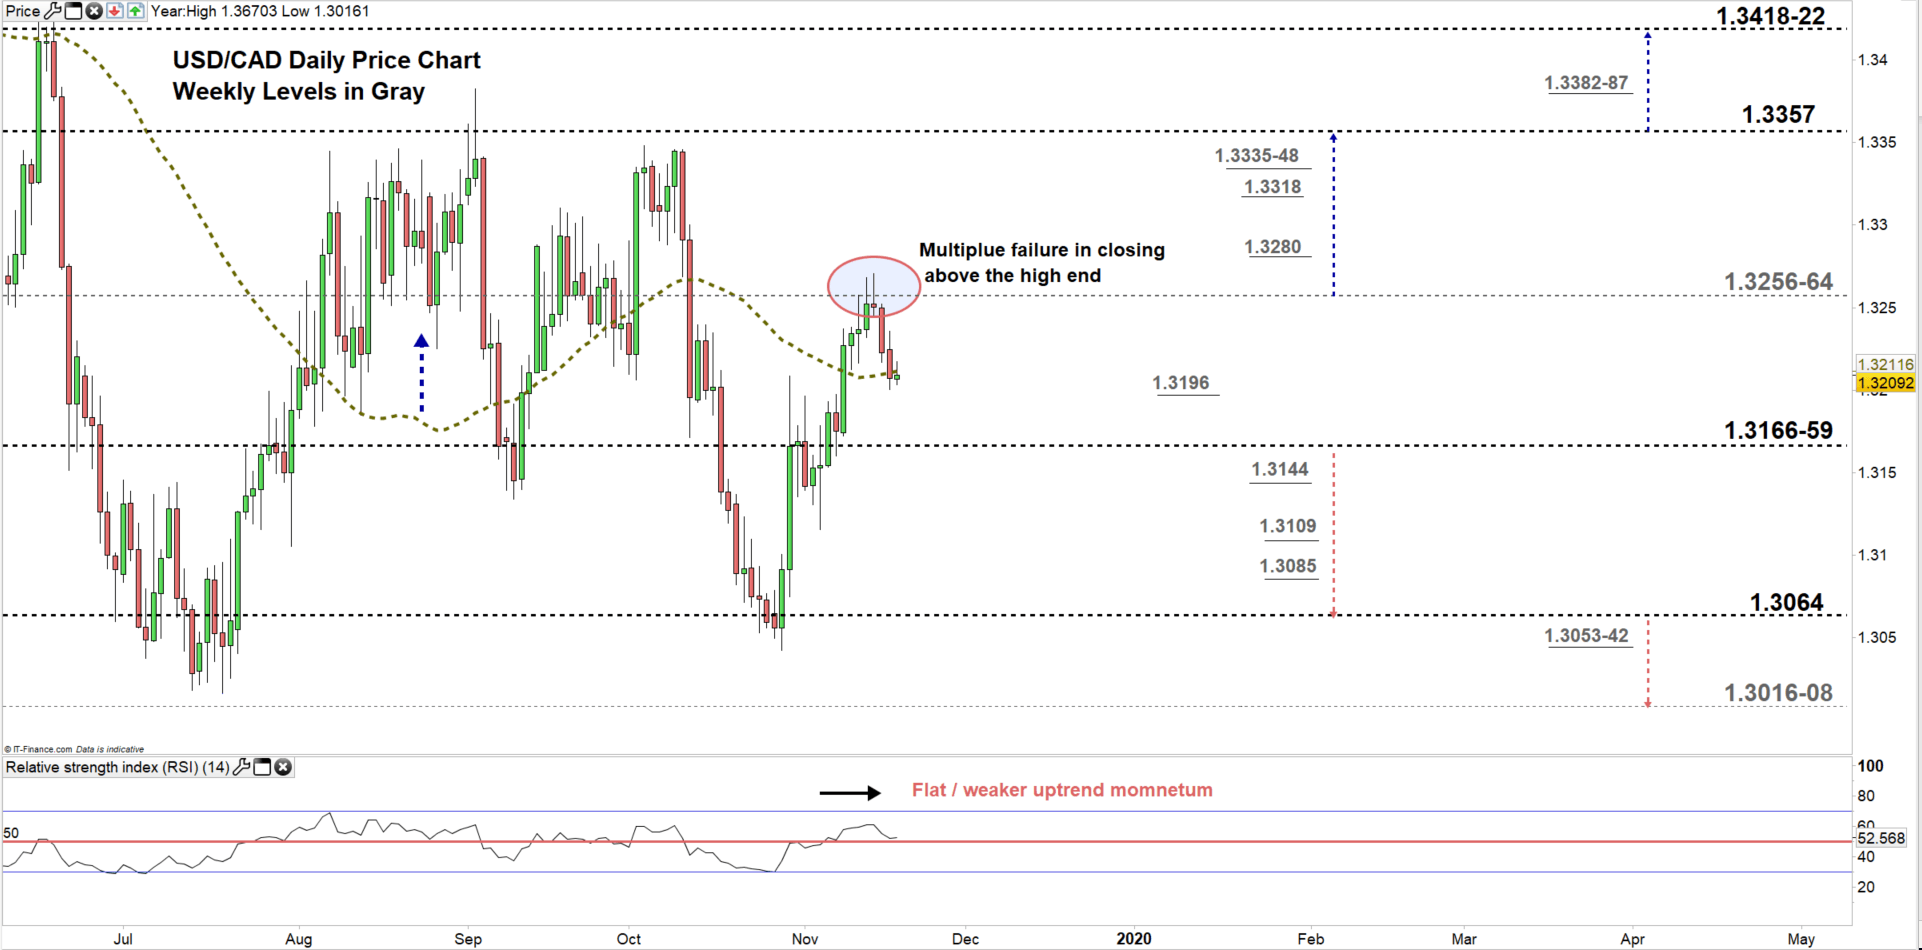
From the daily chart, we notice last week USD/CAD failed in multiple occasions in closing above the high end of current trading zone 1.3166 – 1.3256, reflecting buyer’s exit from the market. Therefore, the pair pointed lower as discussed in our last update, then closed yesterday below 50-day average looking for a test of the low end of the zone.
A close below the low end, may open the door for sellers to take the initiative and press USDCAD towards 1.3064. Although, the weekly support levels underlined on the chart (zoomed in) offer potential exit points for them. Hence, a close attention should be paid to those levels.
That said, any U-turn before testing the low end of the zone would mean buyer’s attempt to resume leading the price. Even so, a close above its high end may be needed to pave the way towards 1.3357. In that scenario, the weekly resistance levels underscored on the chart should be kept in focus.
Having trouble with your trading strategy? Here’s the #1 Mistake That Traders Make
USD/CAD four hour PRICE CHART (Oct 8 – Nov 19, 2019)

Looking at the four- hour chart, we notice on Friday USD/CAD broke below the neckline of double top pattern located at 1.3235 eyeing a test of 1.3203. Yesterday, the pair rebounded from this level as sellers took profit.
A break below 1.3196 could cause more bearishness towards 1.3171. Yet, the daily support level underlined on the chart should be considered. On the flip side, a break above 1.3247 may push the price towards the Nov 14 high at 1.3270. Although, the high end of the aforementioned trading zone discussed above on the daily chart would be worth monitoring.
See the chart to know more about key levels to monitor in a further bullish/bearish move.
Written By: Mahmoud Alkudsi
Please feel free to contact me on Twitter: @Malkudsi


