


Canadian Dollar Forecast
- USD/CAD charts and analysis
- Canadian Dollar price action against US Dollar
Check our latest Q4 forecasts for free and learn what is likely to move the markets at this time of the year.
USD/CAD – Bearish Development
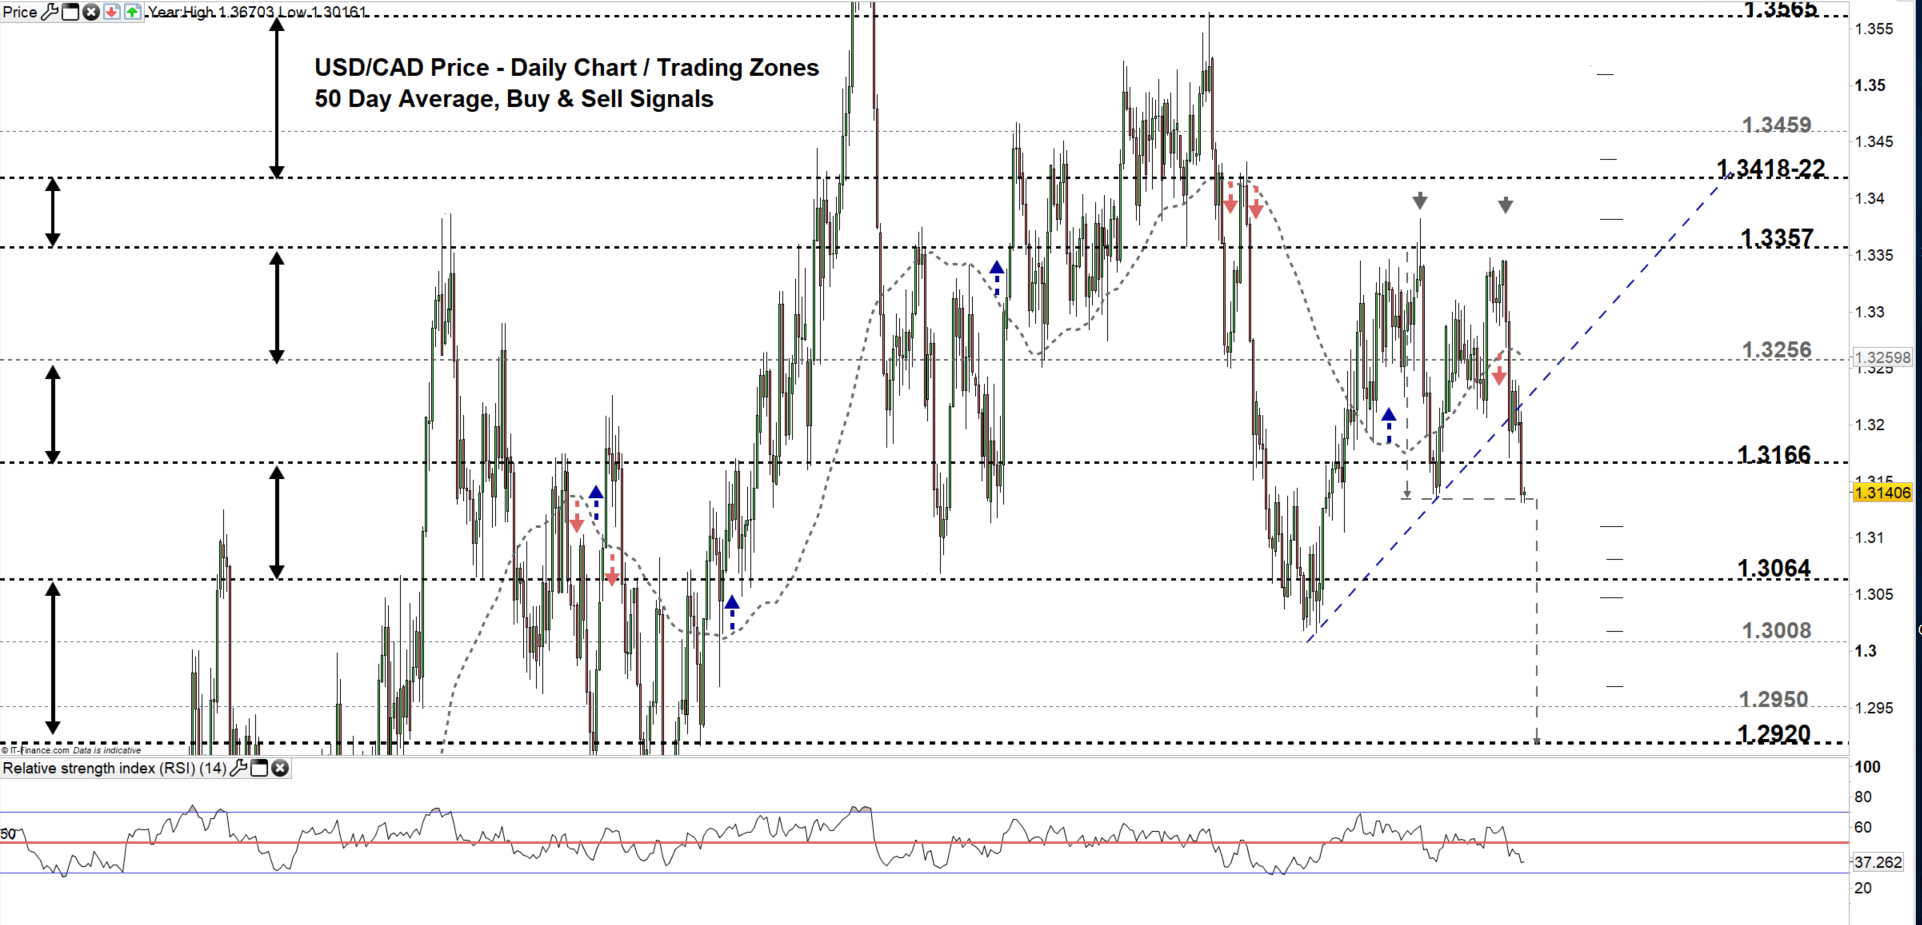
Last week, USD/CAD closed below the 50-Day average generating first signal to end sideways move. Yesterday, sellers resumed bearish price action and led USD/CAD to 1.3131 - its lowest levels in over five weeks.
This week, the Relative Strength Index (RSI) remained below 50 highlighting seller’s dominance and the bearish outlook of the market.
Just getting started? See our Beginners’ Guide for FX traders
USD/CAD DAILY PRICE CHART (DEC 18, 2017 – OCT 18, 2019) Zoomed Out
USD/CAD DAILY PRICE CHART (July 17– Oct 18, 2019) Zoomed In
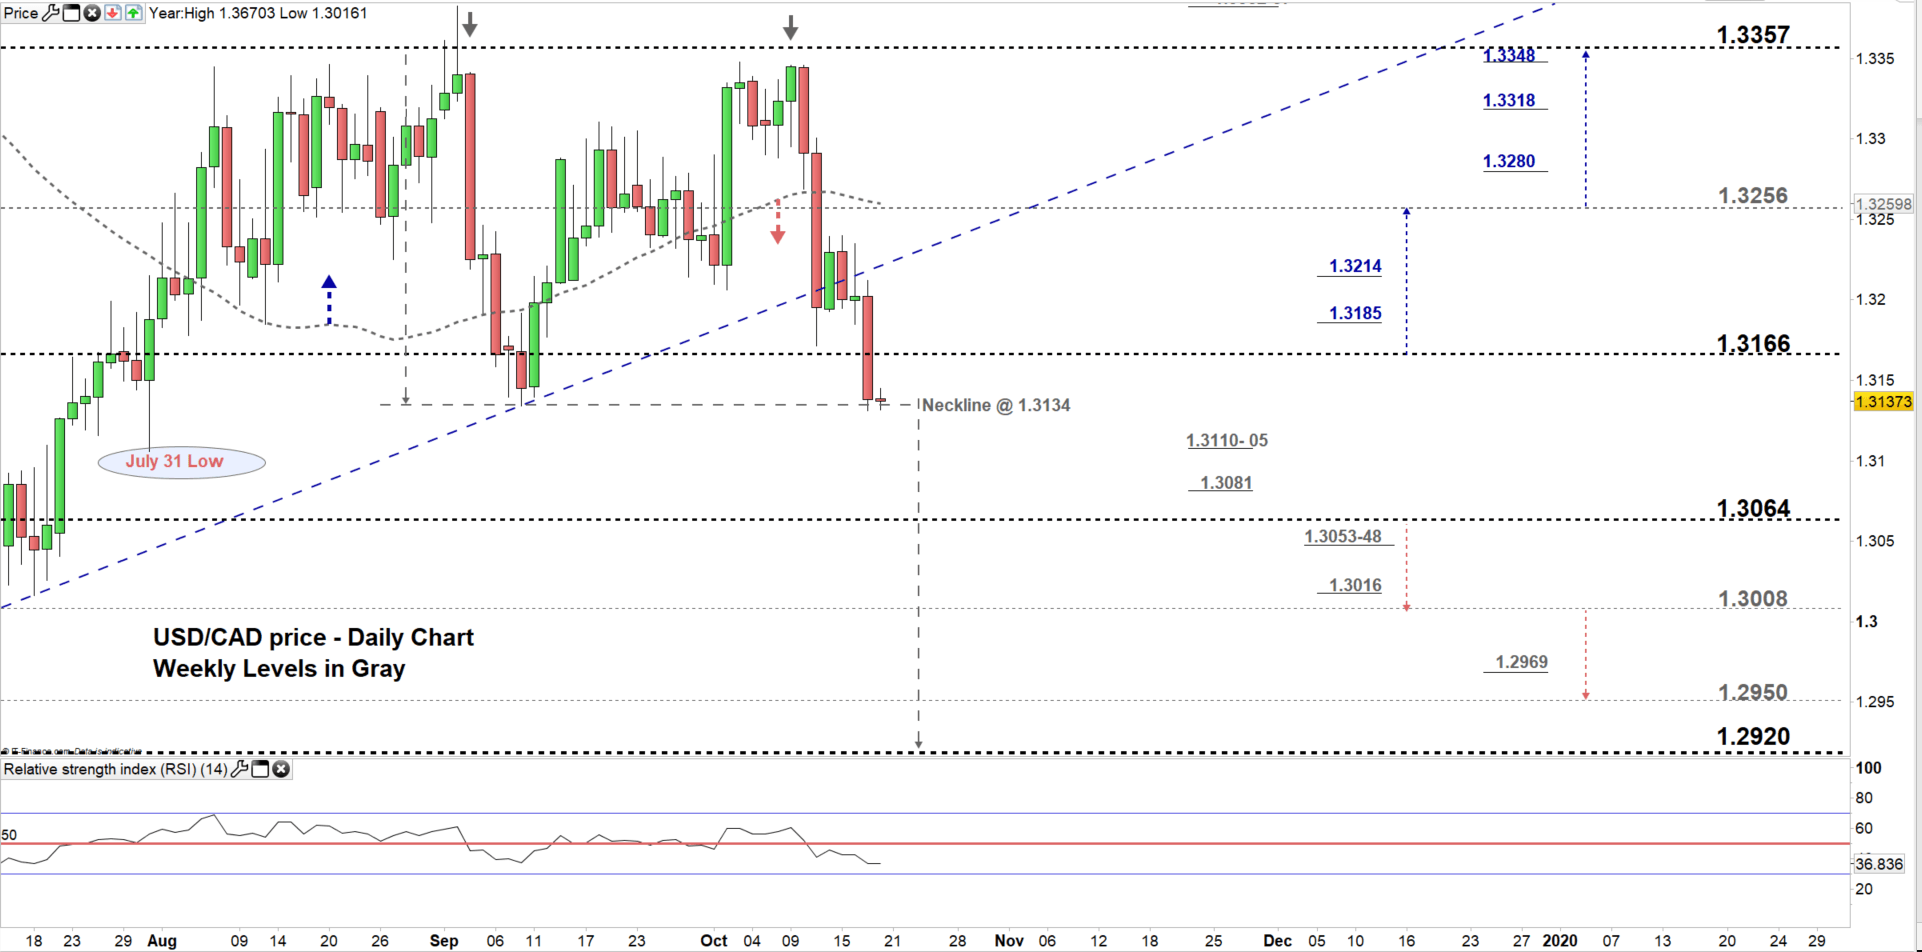
From the daily chart, we notice yesterday USD/CAD declined to a lower trading zone 1.3064 – 1.3166. Additionally, the price tested the neckline of double top pattern suggesting if breaks and remains below 1.3134 this may lead the pair towards 1.2920 (See the chart).
It’s worth mentioning that, any close below the low end of the zone could press USDCAD towards 1.3008. Although, the weekly support area and level marked on the chart (zoomed in) should be kept in focus.
Having said that, a close above the high end (above 1.3166) could mean a pause for the current downtrend move consequently, might trigger a rally towards 1.3256. Albeit, buyers in this case should pay attention to the daily resistance levels underlined on the chart.
Having trouble with your trading strategy? Here’s the #1 Mistake That Traders Make
USD/CAD four hour PRICE CHART (AUG 29 – Oct 15, 2019)

Looking at the four- hour chart, we notice on Oct 11 USD/CAD broke below 1.3287 then started a downtrend move creating lower highs with lower lows.
Currently, the price is testing again the aforementioned neckline, if sellers clear this level a break below 1.3105 could lead USDCAD towards the low end of the trading zone we discussed above on the daily chart. Nevertheless, the weekly support level underlined on the chart should be considered.
On the other hand, any failure to clear the neckline could push the price higher, in that scenario a break above 1.3185 could send USDCAD towards 1.3256. However, the daily resistance underscored on the chart needs to be watched closely.
See the chart to know more about key levels to monitor in a further bullish/bearish move.
Written By: Mahmoud Alkudsi
Please feel free to contact me on Twitter: @Malkudsi


