


Canadian Dollar Forecast
- USD/CAD & EUR/CAD charts and analysis
- Canadian Dollar price action against US Dollar and Euro
Check our latest Q3 forecasts for free and learn what is likely to move the markets at this time of the year.
EUR/CAD, USD/CAD – Interrupted Rally
On Wednesday, USD/CAD rebounded from 1.3206 and rallied to its highest levels in four weeks. On the following day, the pair closed with a Doji pattern indicating to the market’s indecision at this stage.
Similarly, EUR/CAD rallied and recovered the losses of last two weeks. However, the price slipped back highlighting buyer’s hesitation to keep pushing the price higher.
Alongside this, the Relative Strength Index (RSI) crossed above 50 on both pairs reflecting the buyer’s gain of momentum.
Just getting started? See our Beginners’ Guide for FX traders
USD/CAD DAILY PRICE CHART (DEC 20, 2017 – OCT 4, 2019) Zoomed Out

USD/CAD DAILY PRICE CHART (April 16 – Oct 4, 2019) Zoomed In
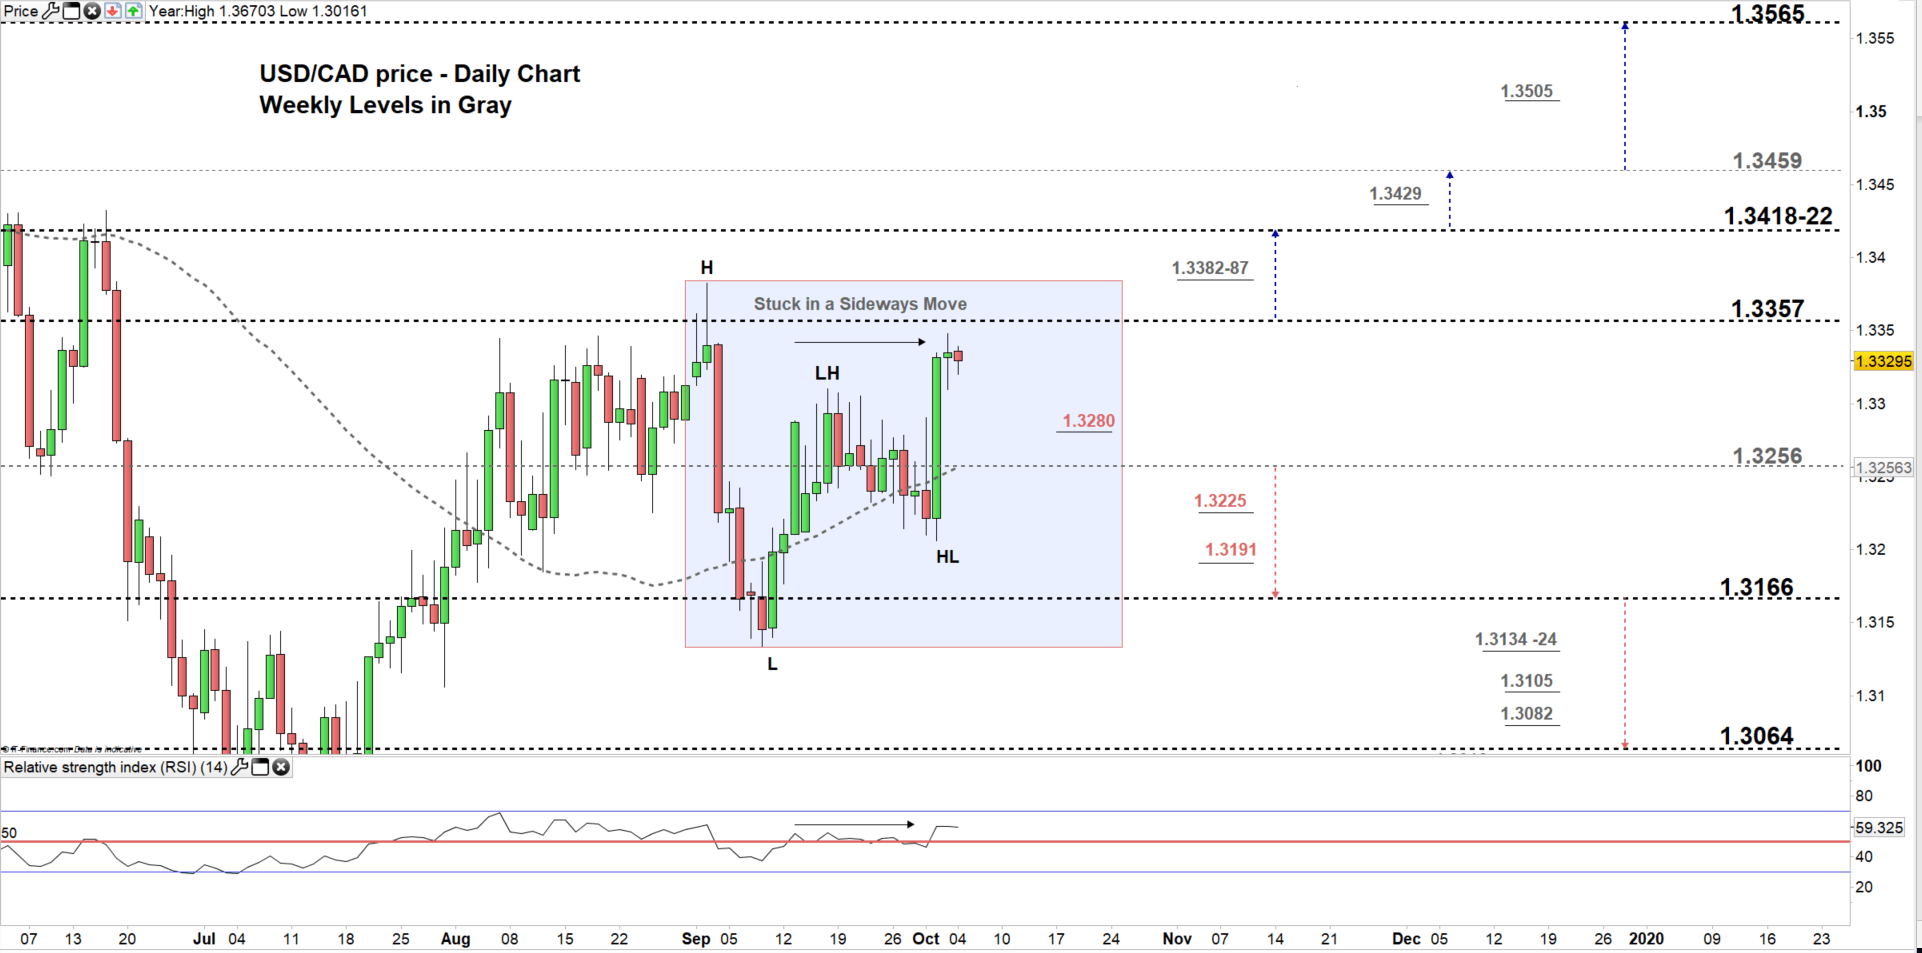
From the daily chart, we notice on Wednesday USD/CAD rallied above 50- day average, then climbed back to same old trading zone 1.3256 – 1.3357 eyeing a test of the high end of it.
Thus, a close above the high end could embolden USDCAD ‘s buyers to lead the price towards 1.3418. Nevertheless, the weekly resistance area marked on the chart (zoomed in) should be considered. In that scenario, current sideways move could end.
On the flip -side, any failure to close above the high end of the zone could mean more of the same, sending USDCAD towards the low end of the zone. However, the price should clear first the daily support level underscored on the chart.
See the chart , to know more about trading zone/s with the key technical levels to monitor if the price moves in a clear direction.
Having trouble with your trading strategy? Here’s the #1 Mistake That Traders Make
EUR/CAD DAILY PRICE CHART (Jan 3, 2017– Oct 4, 2019) Zoomed Out

EUR/CAD DAILY PRICE CHART (June 12 – Oct 4, 2019) Zoomed In
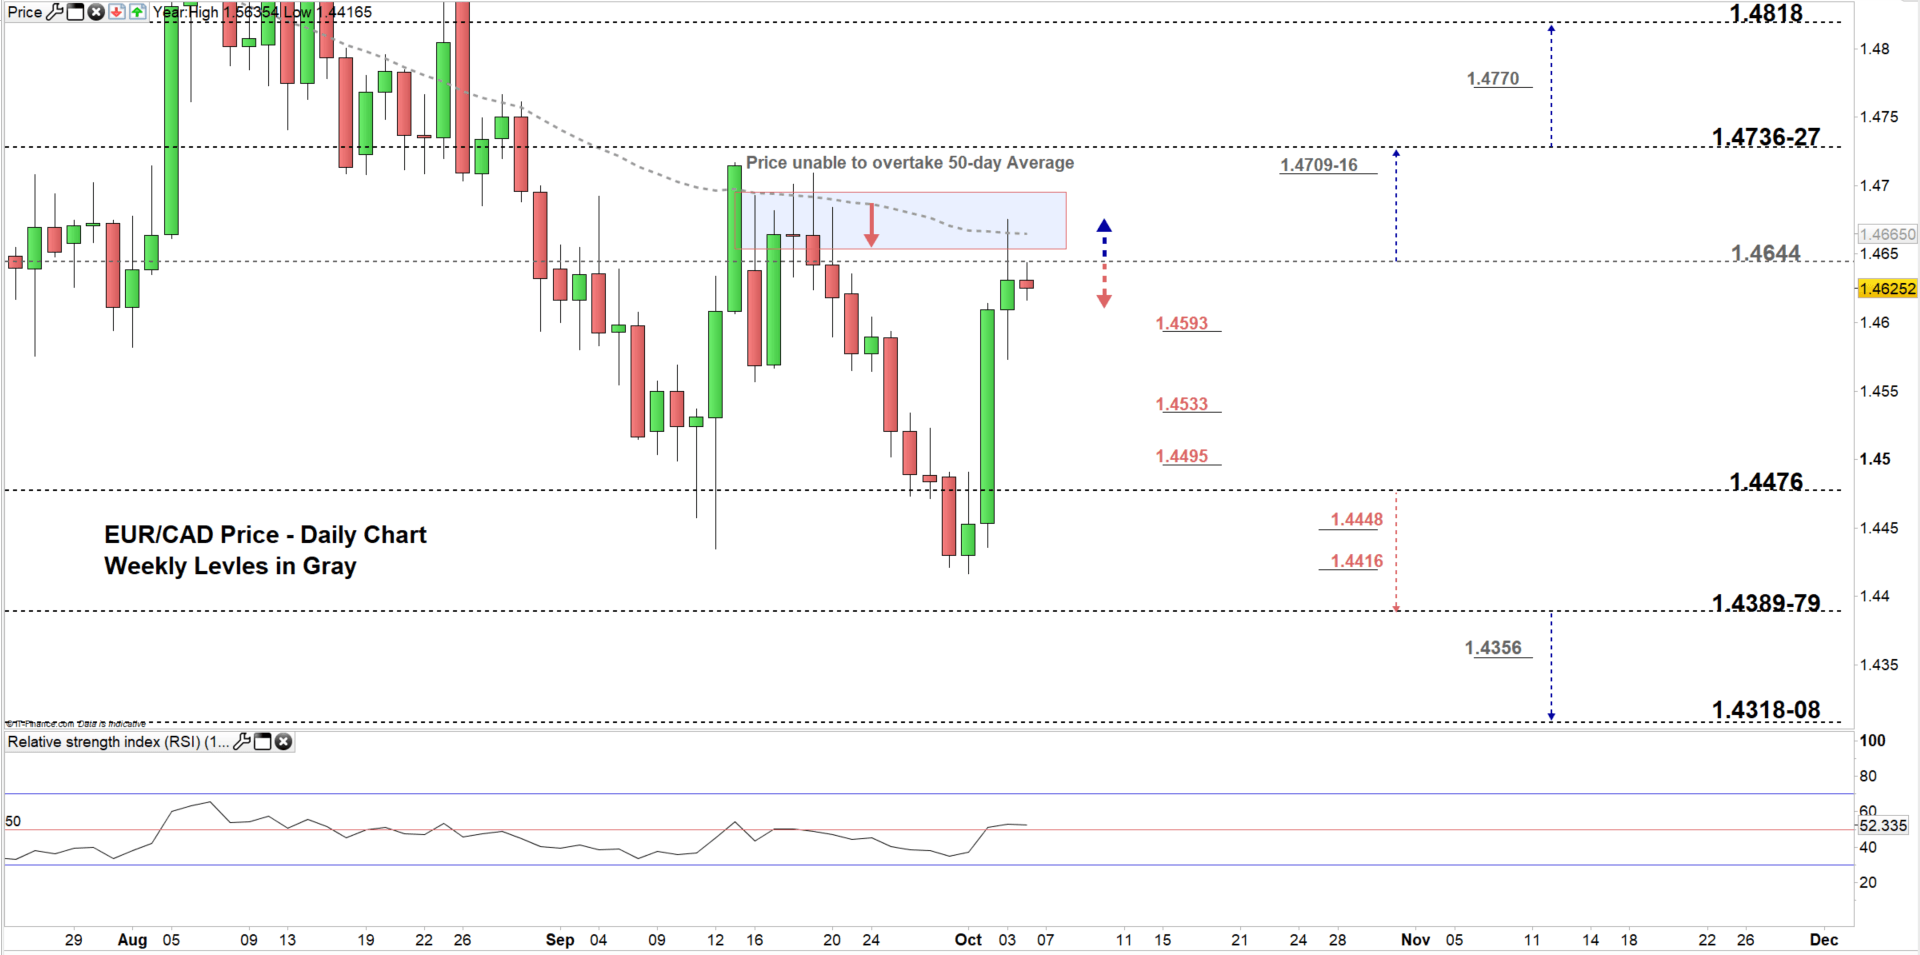
Looking at the daily chart, we notice on Wednesday EUR/CAD reversed direction and rallied back towards a higher trading zone 1.4476- 1.4644. Yesterday, buyers were not successful at overtaking the 50-day moving average nor in pushing the price to a higher trading zone.
Hence, EURCAD could be on its way for a test of the low end of current trading zone, contingent on clearing the daily support levels underlined on the chart (zoomed in). Further close below the low end could see the price trading towards the vicinity of 1.4389-79. However, the daily support levels should be considered.
That said, any successful close above the high end of the zone, may push EURCAD towards the vicinity of 1.4736-27. Although, the weekly resistance area marked on the chart should be kept in focus.
We value your opinion, please access short online survey
Written By: Mahmoud Alkudsi
Please feel free to contact me on Twitter: @Malkudsi


