


Canadian Dollar Forecast
- USD/CAD & EUR/CAD charts and analysis
- Canadian Dollar price action against US Dollar and Euro
Check our latest Q3 forecasts for free and learn what is likely to move the markets at this time of the year.
EUR/CAD, USD/CAD – Weaker Euro Across the Board
On Sep 18, the rally in USD/CAD stalled after printing 1.3310 – its highest level in two weeks. This week, sellers attempted to press the price lower however, their endeavors have not been successful yet.
With regards to EUR/CAD the pair has been losing value since Sep 19. Yesterday, the price rebounded from a well-defined support level.
Alongside this, the Relative Strength Index (RSI) remained flat above 50 indicating to weak buyers and weaker sellers on USD/CAD. The oscillator declined from 50 to 38 on EUR/CAD emphasizing the bearish outlook of the pair.
Just getting started? See our Beginners’ Guide for FX traders
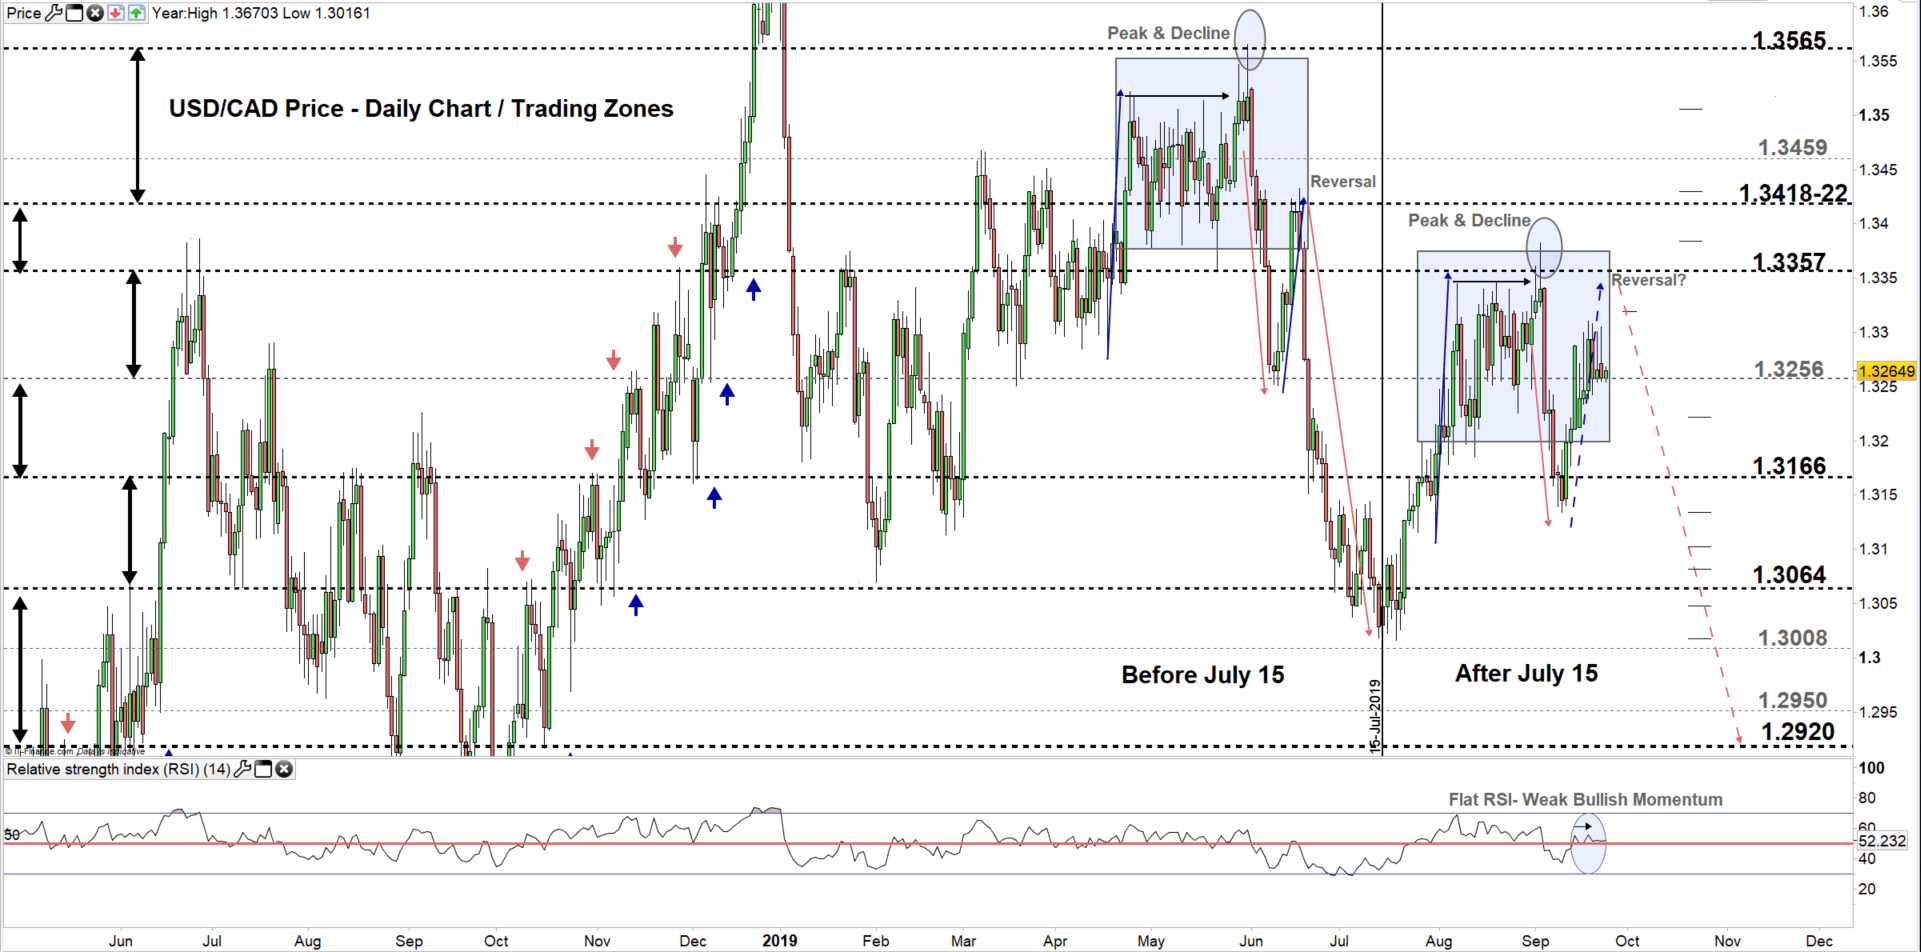
USD/CAD DAILY PRICE CHART (Sep 1, 2017 – Sep 27, 2019) Zoomed Out
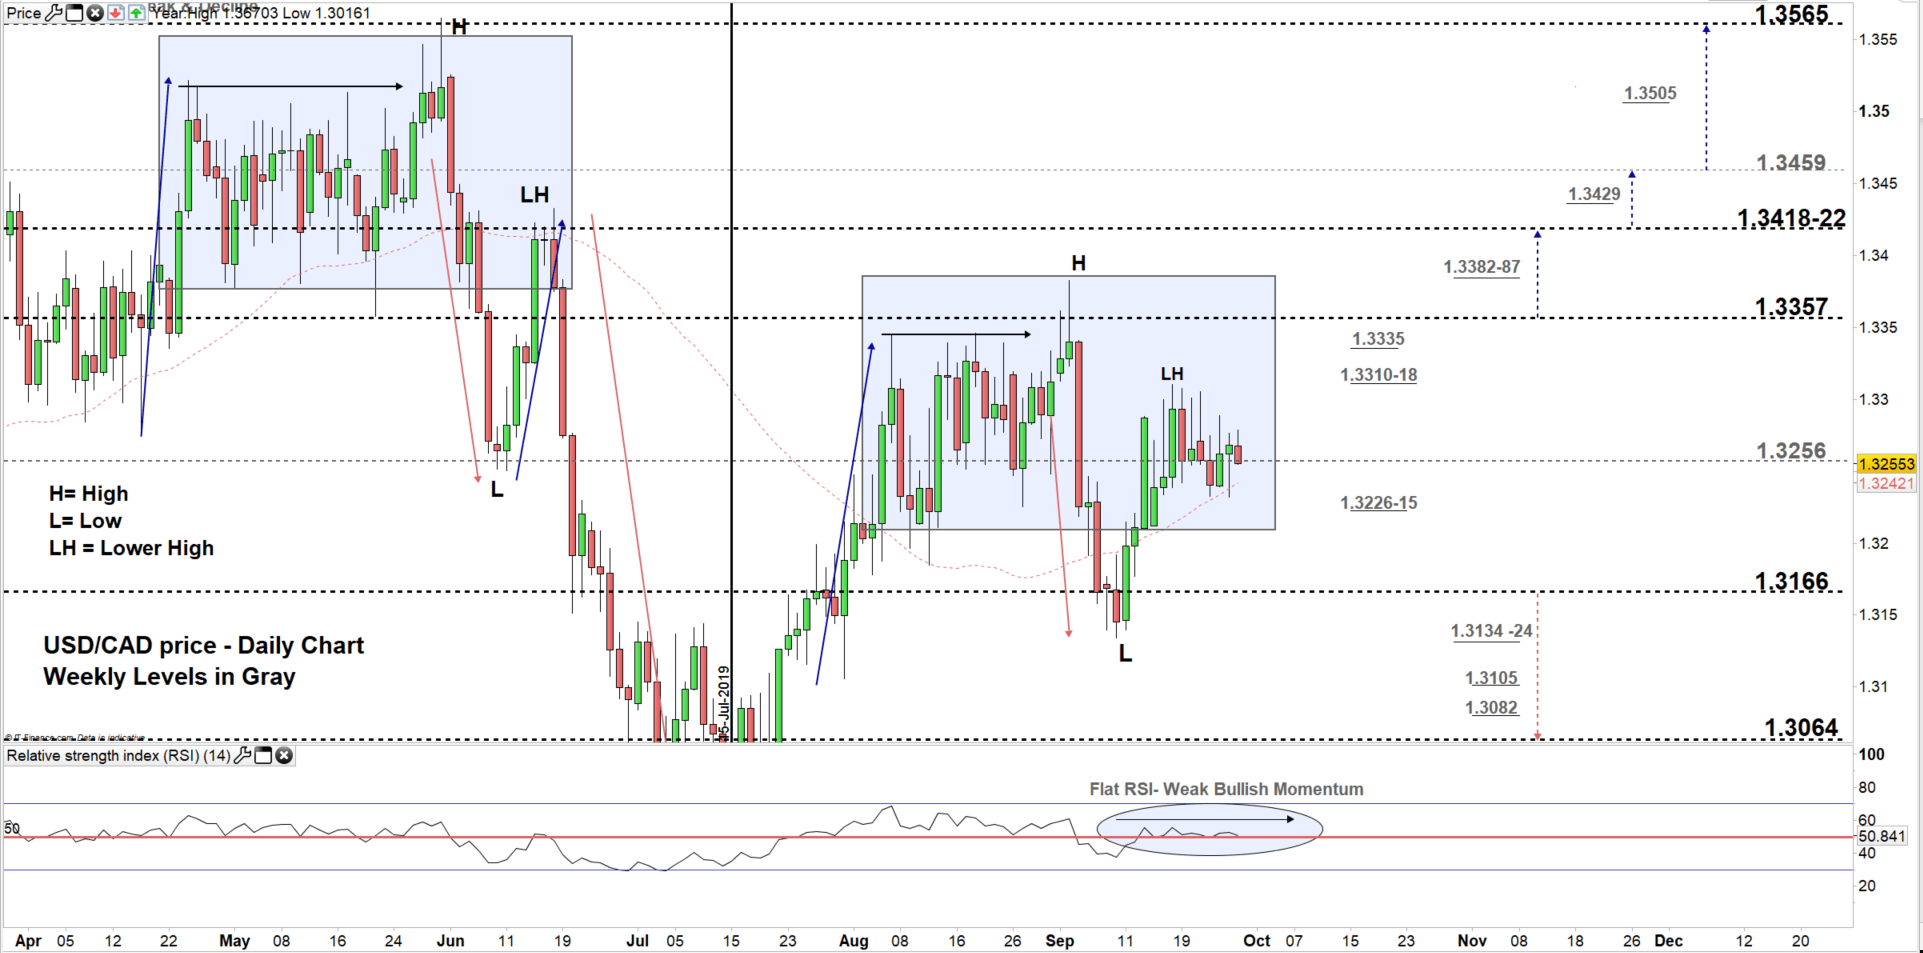
USD/CAD DAILY PRICE CHART (April 1 – Sep 27, 2019) Zoomed In
From the daily chart, we notice USD/CAD returned to the 1.3256-1.3357 trading zone on Wednesday, leaving the pair trendless. Sellers and buyers are currently battling to gain the upper hand and set the next move in motion.
Thus, the price may be on the way for a test to the high end of the zone. However, USDCAD needs to clear the weekly resistance area and level marked on the chart (zoomed in).
On the other hand, any close below the low end of the zone could be a good signal to see the price trading towards 1.3166. Such signal would be even stronger with the price closing below 50 days moving average at 1.3240. That said, the weekly support area underlined on the chart (zoomed in) should be kept in focus.
Having trouble with your trading strategy? Here’s the #1 Mistake That Traders Make
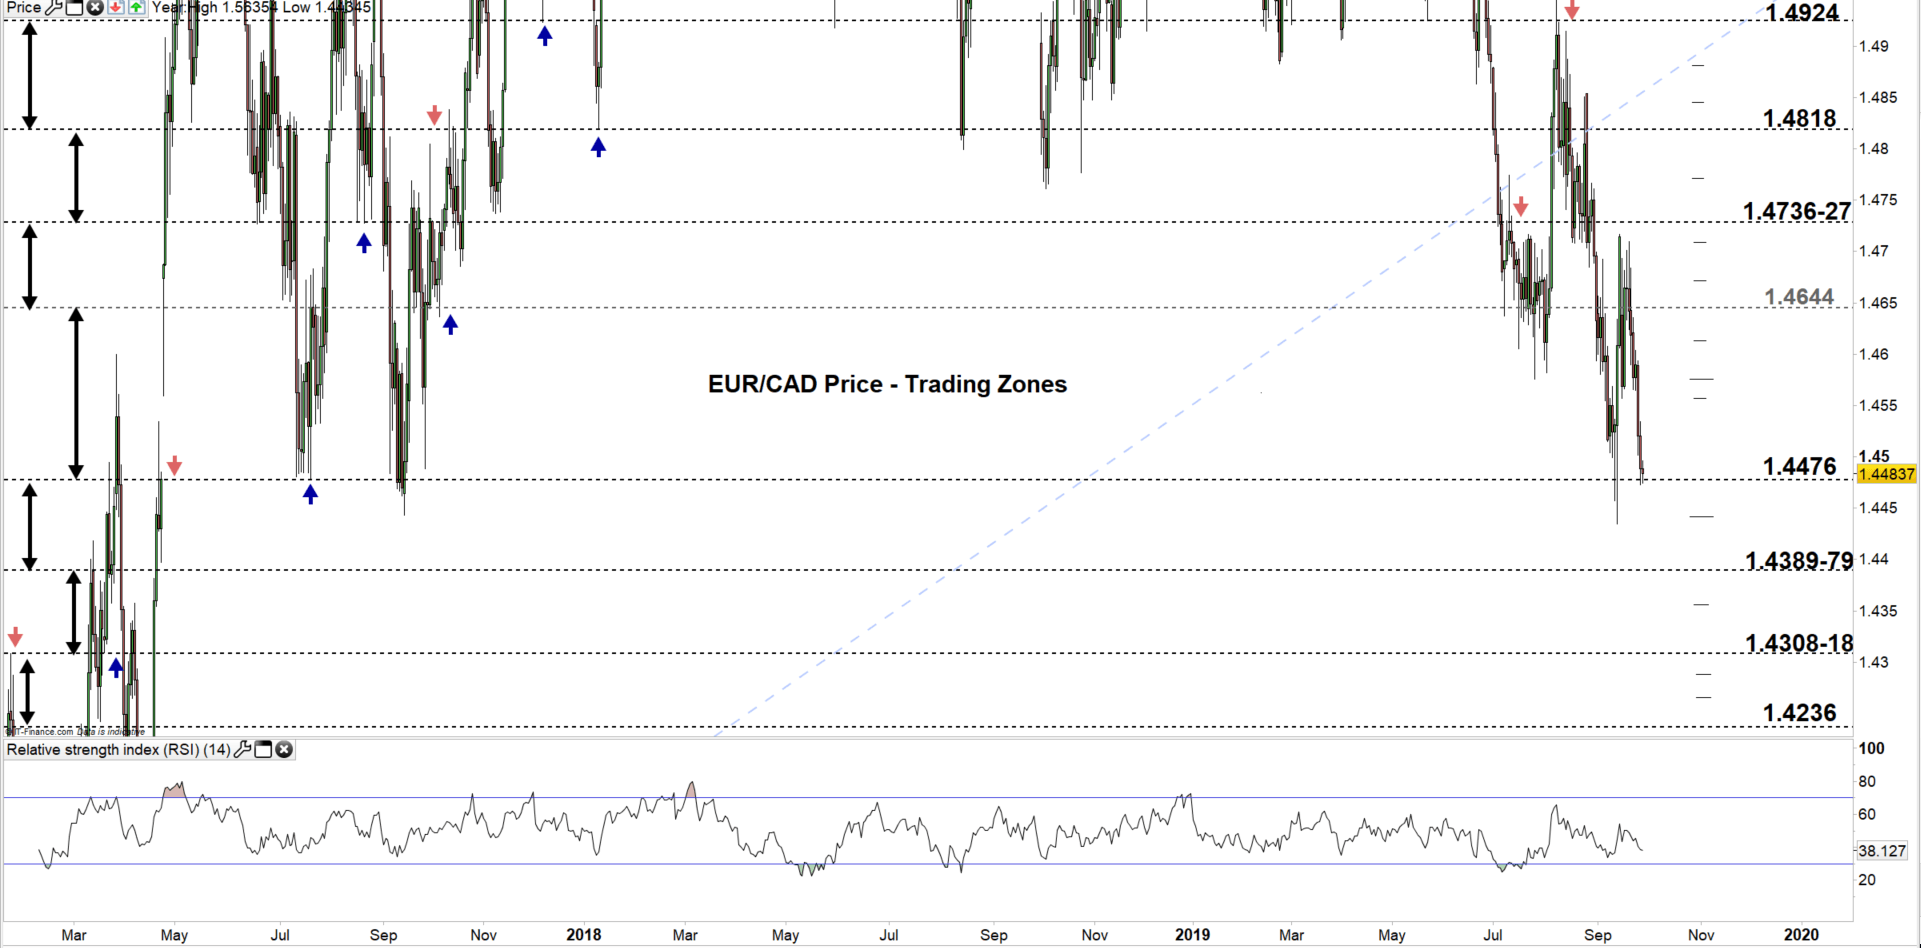
EUR/CAD DAILY PRICE CHART (Jan 12, 2007– Sep 27, 2019) Zoomed Out
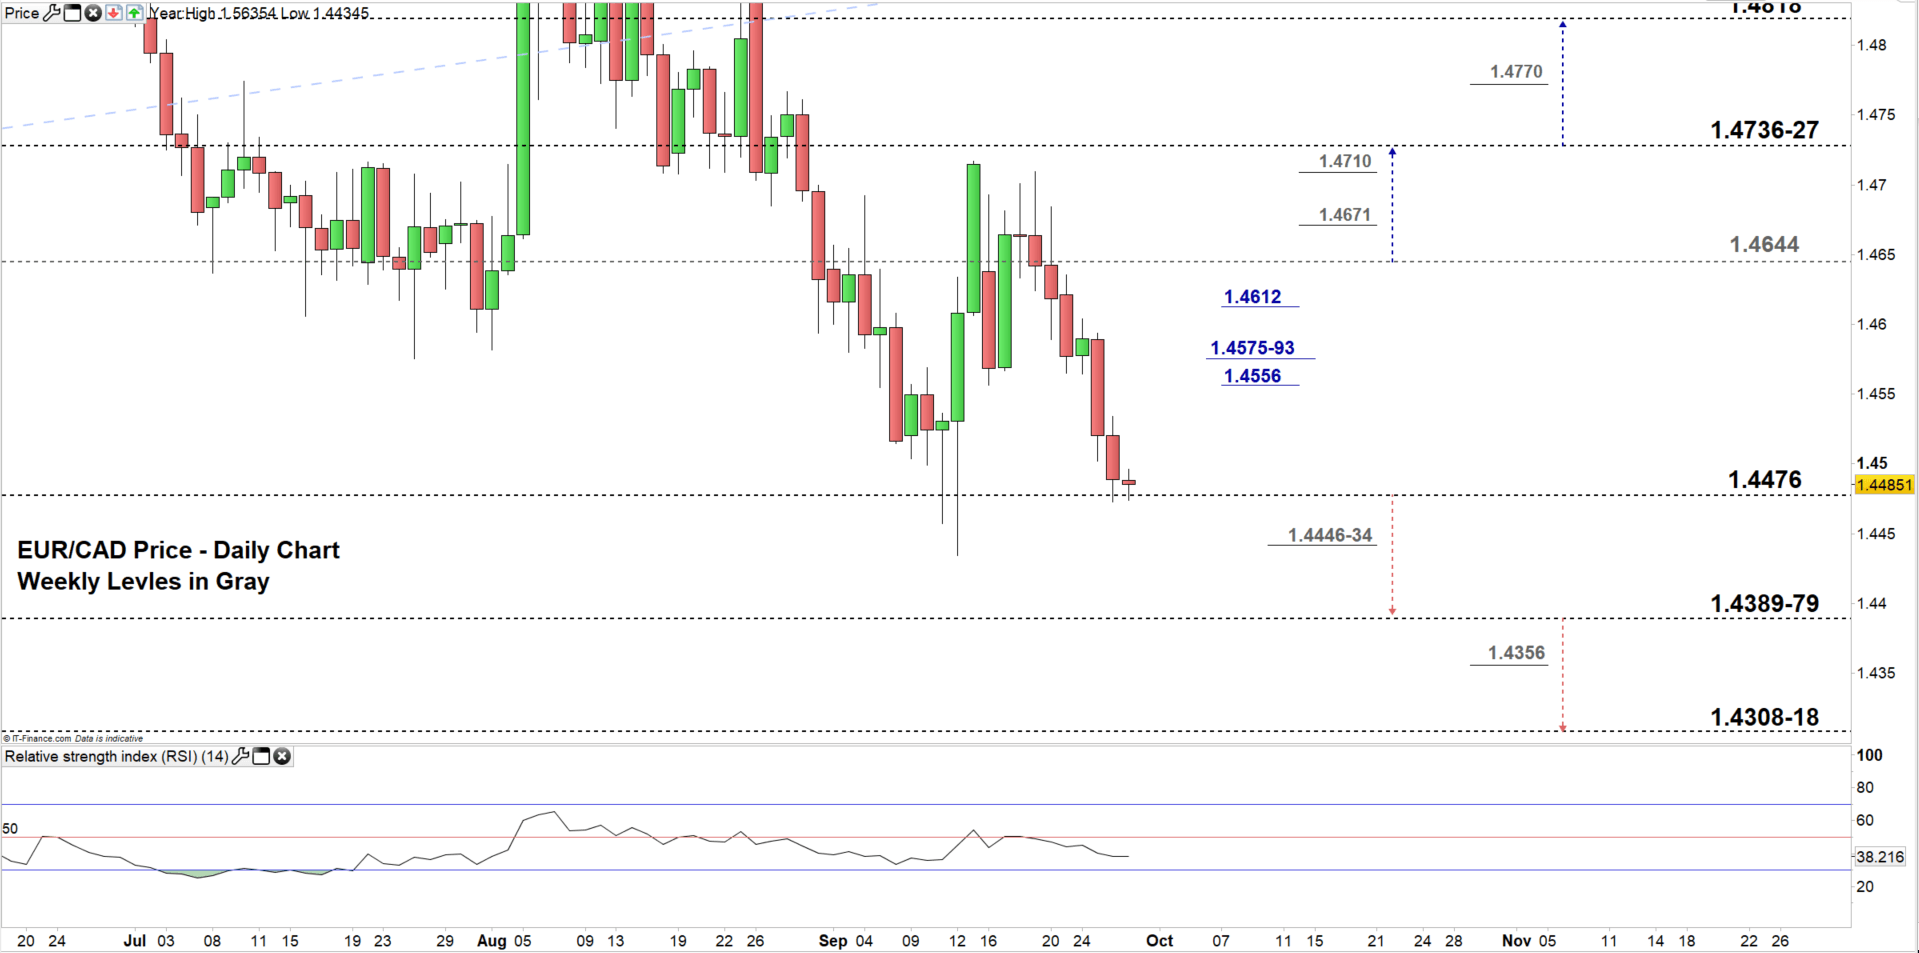
EUR/CAD DAILY PRICE CHART (June 12 – Sep 27, 2019) Zoomed In
Looking at the daily chart, we notice on Sep 20 EUR/CAD declined to a lower trading zone 1.4476 – 1.4644. Yesterday, the price rebounded nearby the low end of the zone.
Hence, the pair may be looking to trade higher towards the high end of the zone, contingent on clearing the daily resistance area and levels marked on the chart (zoomed in). Check EURCAD chart to know more about the higher trading zone/s with weekly resistance levels to monitor in a further bullish move.
On the flip-side, any close below the low end of the zone could see EURCAD trading even lower towards the vicinity of 1.4389-79. Nevertheless, the weekly resistance area underscored on the chart should be kept in focus.
We value your opinion, please access short online survey
Written By: Mahmoud Alkudsi
Please feel free to contact me on Twitter: @Malkudsi


