


Canadian Dollar Forecast
- USD/CAD charts and analysis
- US Dollar against Canadian Dollar price action
Check our latest Q3 forecasts for free and learn what is likely to move the markets at this time of the year.
USD/CAD – From Trendless to Downward
On Sep 10, USD/CAD created a lower low at 1.3134. In the following week the pair created on Wednesday a lower high at 1.3310 shifting the price’s course to the downside.
Alongside this, the Relative Strength Index (RSI) Fell from 55 then remained flat nearby 50 reflecting buyer’s loss of momentum.
Just getting started? See our Beginners’ Guide for FX traders
USD/CAD DAILY PRICE CHART (April 12 – Sep 24, 2019) Zoomed Out

USD/CAD DAILY PRICE CHART (JUly 15 – Sep 24, 2019) Zoomed In
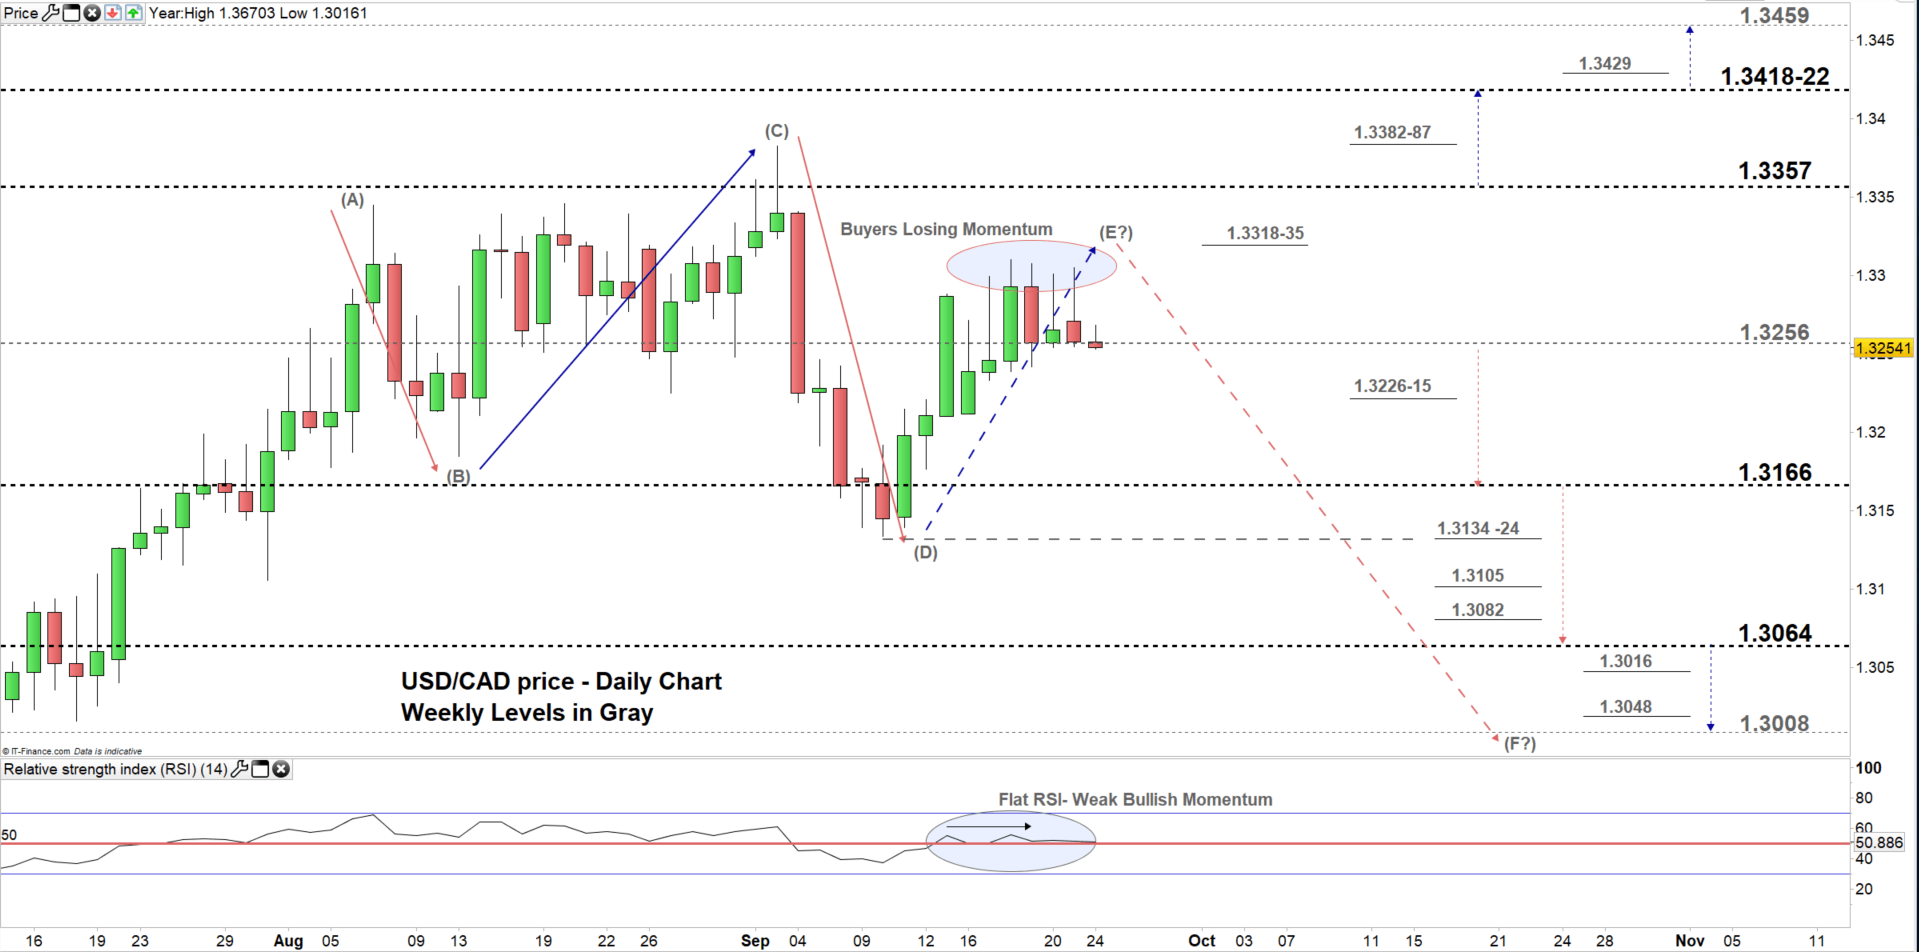
From the daily chart, we notice USD/CAD continue its move according to the pattern discussed in our last update: Consolidation - Peak and decline- Rally followed by reversal, check the chart (zoomed out).
Last week USDCAD rallied to the trading zone 1.3256- 1.3357. Since then sellers failed in multiple occasions to press the price to a lower zone. That said, any close below the low end of the zone could send the pair towards 1.3166. Further close below this level may resume bearish price action towards 1.3064. Although, the weekly support areas and levels underlined on the chart (zoomed in) should be watched along the way.
On the flip-side, a close above the low end of the zone could mean the more of the same i.e. price may keep trading ineffectively eyeing a test of the high end. Further close above the high end could see more effective trading towards the vicinity of 1.3418-22.
Having trouble with your trading strategy? Here’s the #1 Mistake That Traders Make
USD/CAD FOUR-HOUR PRICE CHART (SEP 4 – SEP 24, 2019)
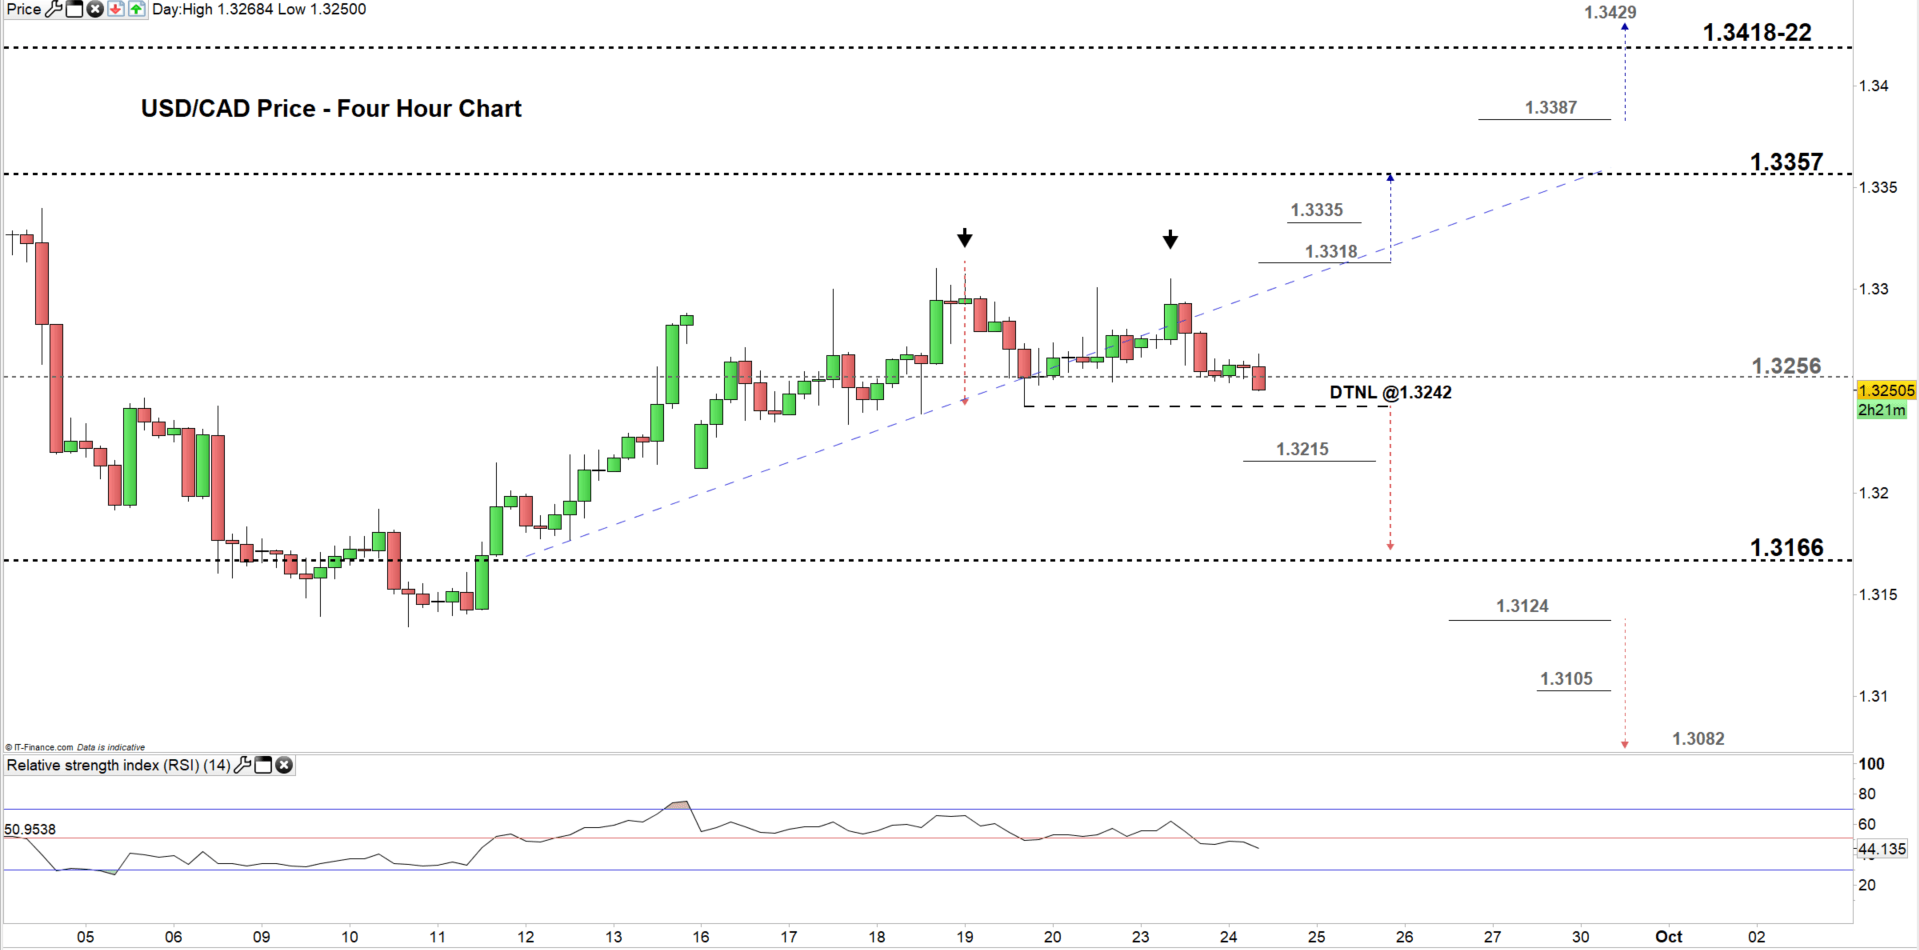
Looking at the four-hour chart, we notice since Sep 12 USD/CAD has been trading to the upside creating higher highs with higher lows. Yesterday, the price rallied to 1.3305 then dropped creating the second top of double top pattern where the neckline resides at 1.3242.
Hence, if the price breaks and remains below the neckline this could send USDCAD towards 1.3166 although, the weekly support area at 1.3215-12 would be worth monitoring.
On the other hand, any rally above the second top would negate the pattern. Thus, a break above 1.3318 could see USDCAD trading towards 1.3357. Nonetheless, the weekly resistance level underscored on the chart should be considered.
We value your opinion, please access short online survey
Written By: Mahmoud Alkudsi
Please feel free to contact me on Twitter: @Malkudsi


