


Canadian Dollar Outlook
- USD/CAD charts and analysis
- US Dollar against Canadian Dollar price action
Check our latest Q3 forecasts for free and learn what is likely to move the markets at this time of the year.
USD/CAD – Buyer’s Struggle
At the start of this week, USD/CAD opened with a gap to the downside at 1.3212. However, the price recovered all the losses and rallied above 1.3300 handle in the following days.
Alongside this the Relative Strength Index (RSI) stayed above 50 emphasizing the uptrend move is still intact. That said, the oscillator failed again nearby 55 then remained flat after, reflecting a slowing uptrend momentum.
Just getting started? See our Beginners’ Guide for FX traders
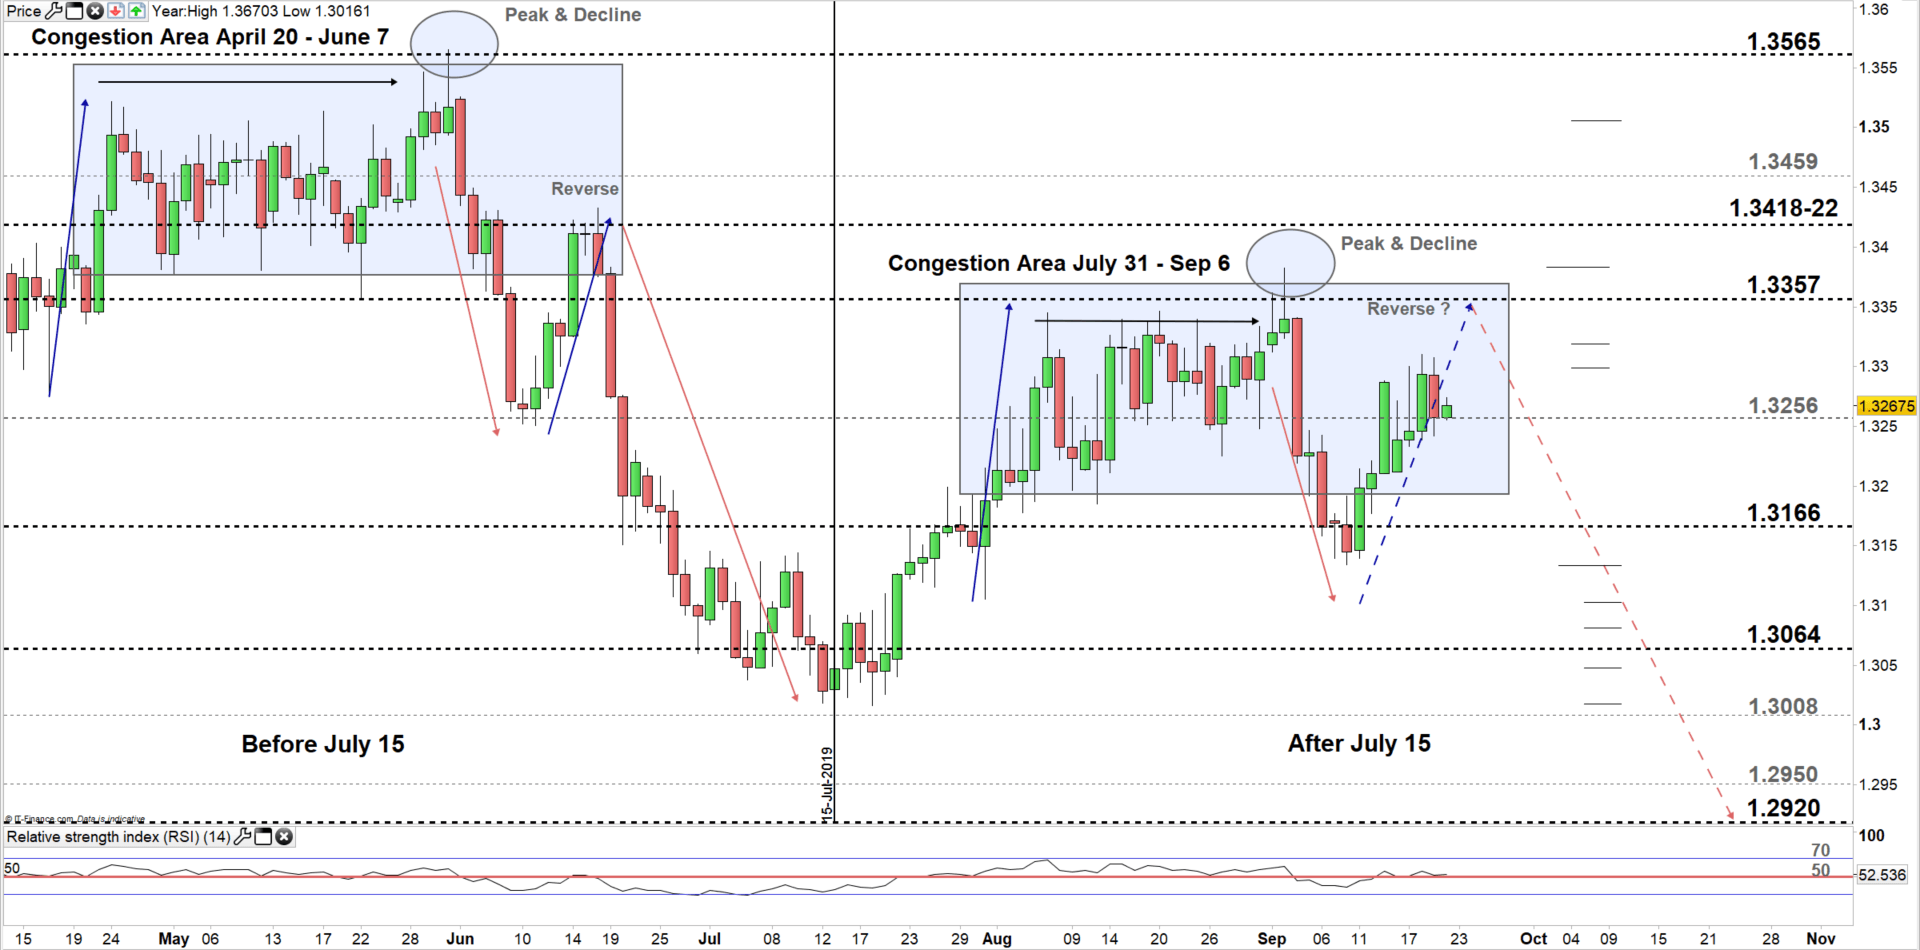
USD/CAD DAILY PRICE CHART (April 12 – Sep 20, 2019) Zoomed Out
Having trouble with your trading strategy? Here’s the #1 Mistake That Traders Make
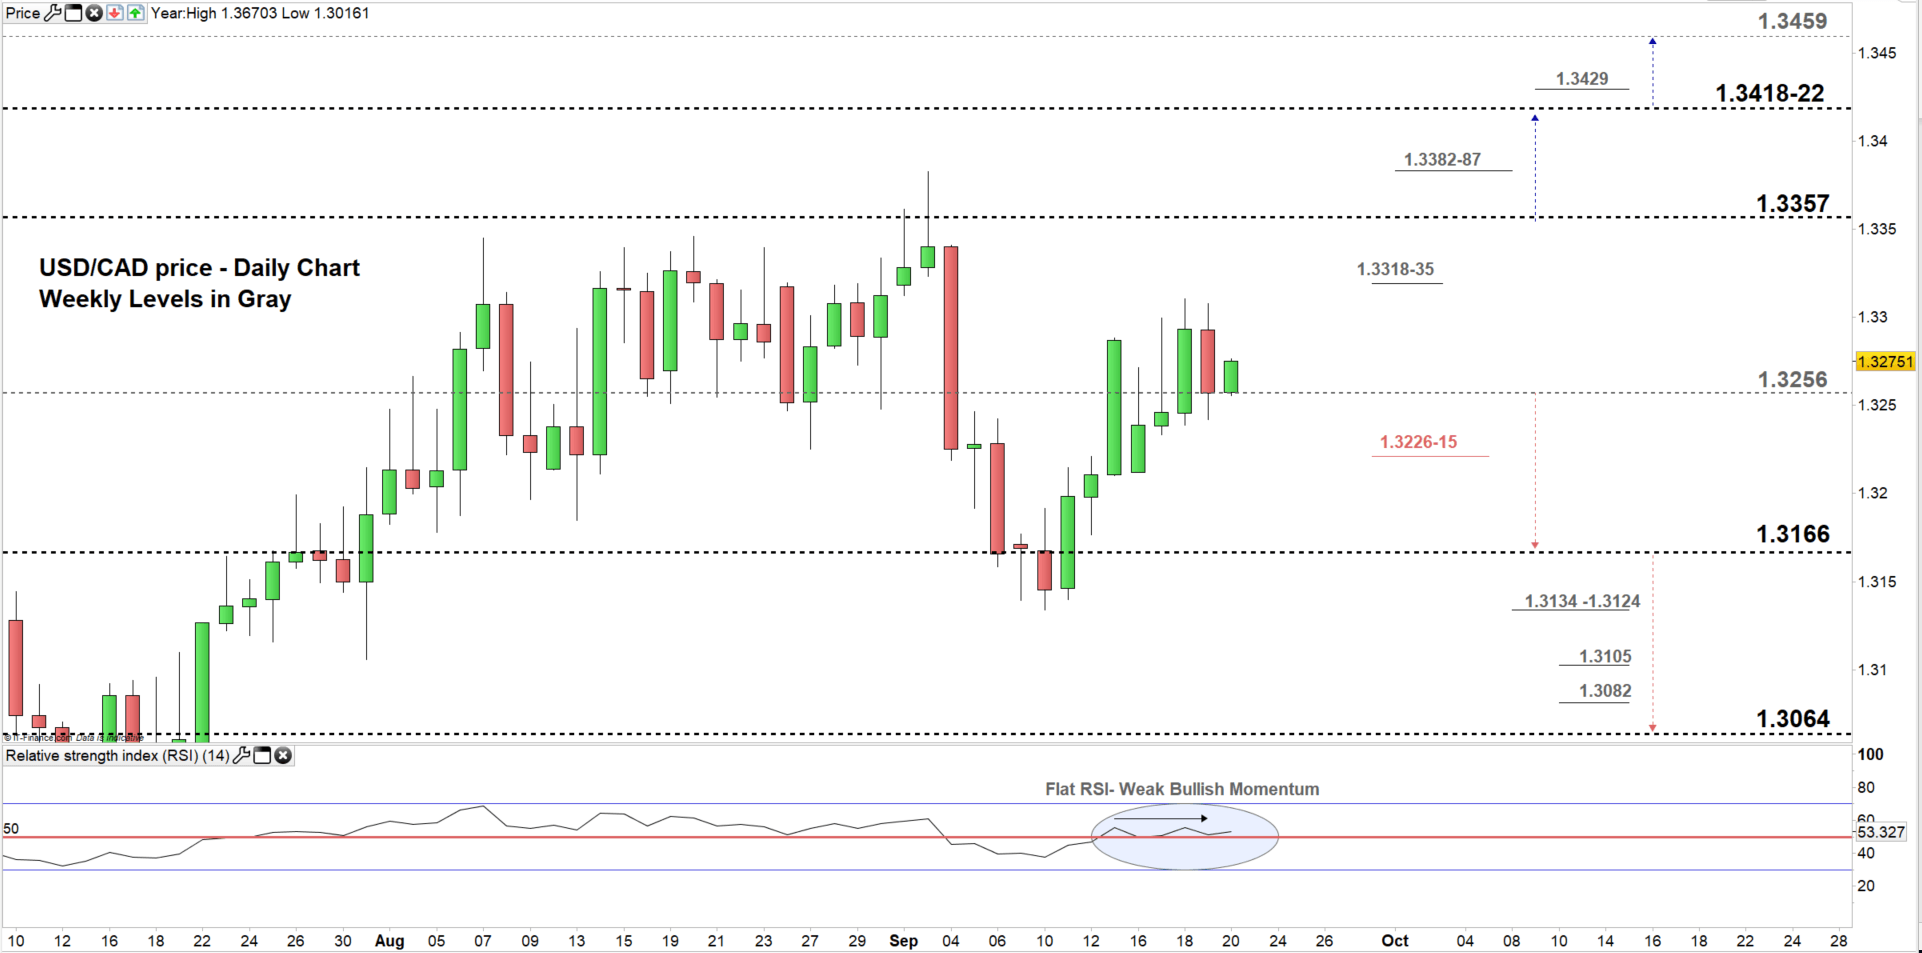
USD/CAD DAILY PRICE CHART (JUly 11 – Sep 20, 2019) Zoomed In
From the daily chart, we notice USD/CAD is currently moving similarly to the way the pair has been moving before July 15. The pattern was: Consolidation - Peak and decline- Rally followed by reversal, see the chart (zoomed out).
On Wednesday, USDCAD moved successfully to a higher trading zone 1.3256 – 1.3356. The price yesterday tested trading in a lower zone however, reverted back to the aforementioned trading zone.
Hence, the pair may be on its way for a test of the high end of the zone contingent on clearing the weekly resistance area underlined on the chart (zoomed in). Further close above the high end could push USDCAD towards the vicinity of 1.3418-22. That said, the weekly resistance area marked on the chart should be kept in focus.
On the flip side, a successful close below the low end of the zone may press USDCAD towards 1.3166. Nonetheless, the daily support area marked on the chart would be worth monitoring.
USD/CAD Four-HOUR PRICE CHART (Sep 2 – Sep 20, 2019)

Looking at the four-hour chart, we notice this week USD/CAD has been leaning to the upside creating on Tuesday a high then a higher high on Wednesday, with a low followed by higher lows.
Thus, a break above Wednesday’s high may resume bullish price action i.e. any rally above 1.3318 could push USDCAD towards 1.3357. However, buyers would need to consider the weekly resistance level underscored on the chart. See the chart to know more about higher resistance levels price would test in a further bullish scenario.
On the other hand, sellers may take the initiative if USDCAD falls below Tuesday’s low. Therefore, any break below 1.3215 might send the price towards 1.3183. Although, the weekly support underlined on the chart needs to be monitored. See the chart to find out more about lower support levels price would encounter in a further bearish scenario
We value your opinion, please access short online survey
Written By: Mahmoud Alkudsi
Please feel free to contact me on Twitter: @Malkudsi


