


Canadian Dollar Forecast
- USD/CAD charts and analysis
- US Dollar against Canadian Dollar price action
Have you seen our newest trading guides for USD, EUR and Gold ? Download for free our latest forecasts
USD/CAD – From Bullish to Bearish
Last week, USD/CAD printed its highest level in over six weeks at 1.3346. However, the pair slipped back after, then settled below 1.3300 handle closing the weekly candlestick with a bearish Doji pattern indicating to a possible reversal on the horizon.
Since Mid- August, the Relative Strength Index (RSI) has been creating lower highs, highlighting the uptrend move’s loss of momentum. Today, the oscillator crossed below 50 indicating to a possible start of downtrend move.
Just getting started? See our Beginners’ Guide for FX traders
USD/CAD DAILY PRICE CHART (Sep 30, 2017 – AUG 27, 2019) Zoomed Out

USD/CAD DAILY PRICE CHART (June 20 – AUG 27, 2019) Zoomed In
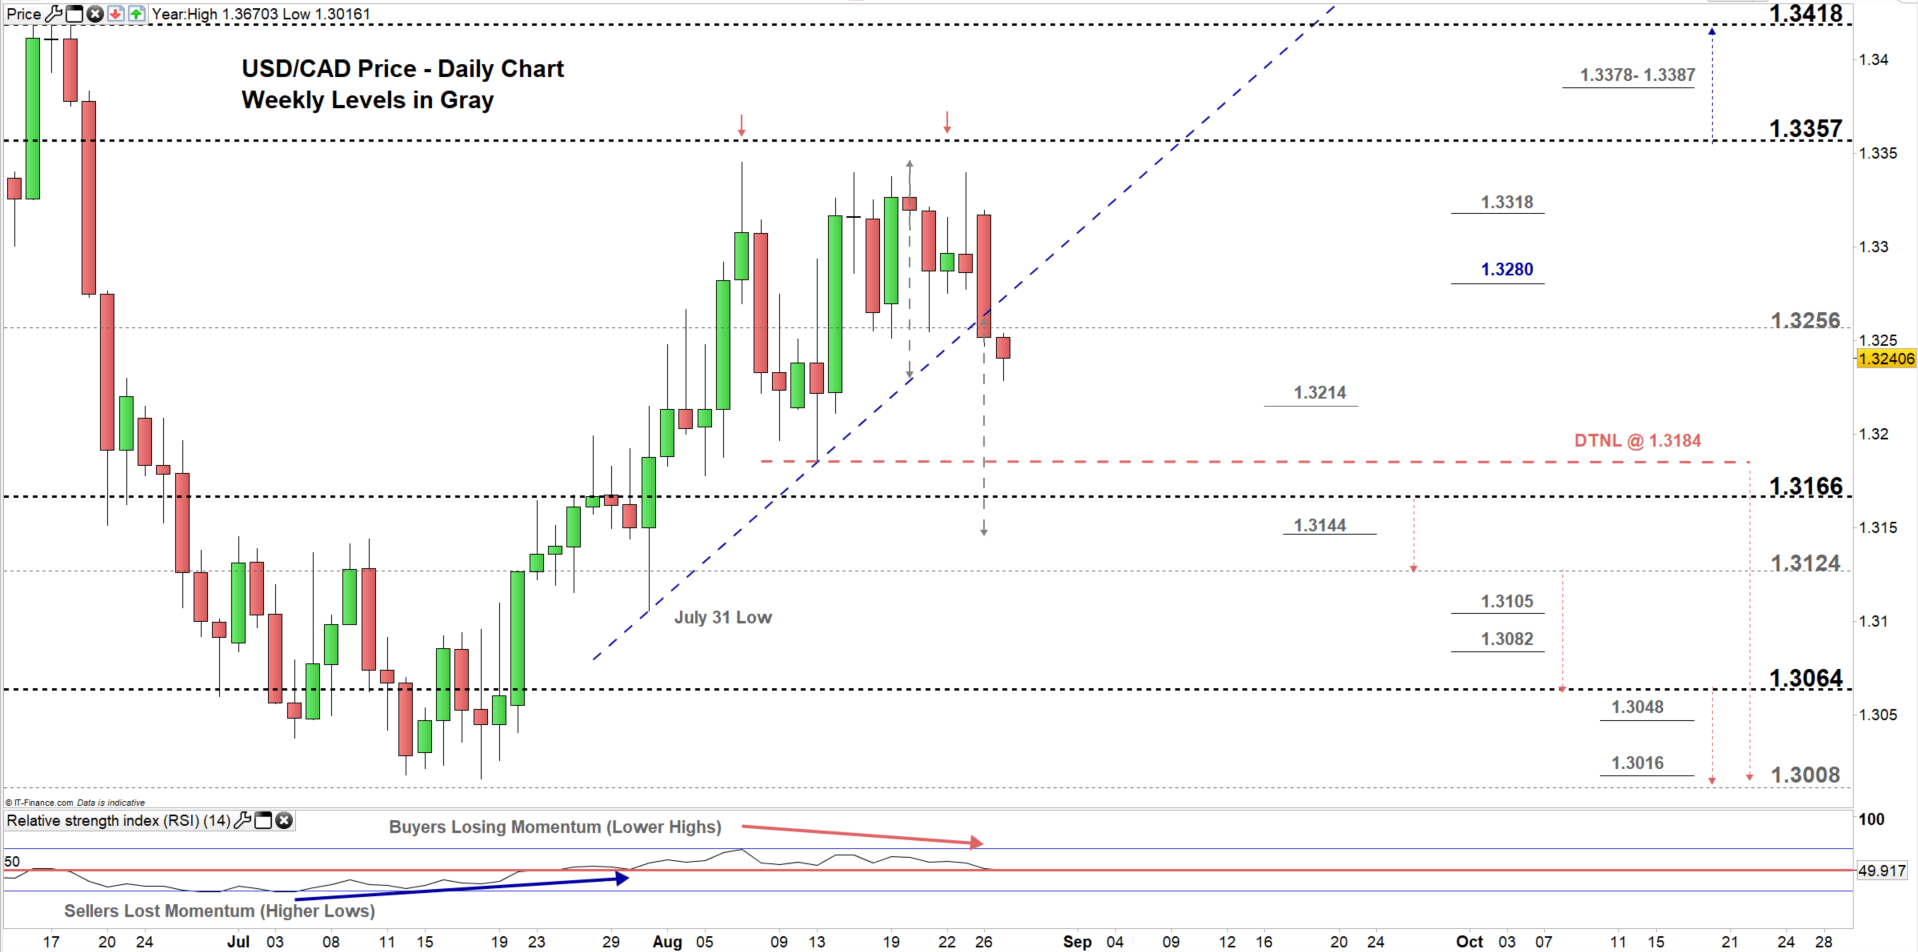
Looking at the daily chart we notice, yesterday USD/CAD moved to the lower trading zone 1.3166 – 1.3256. Thus, sellers may press the price lower for a test of the low end on the zone although, the weekly support level underlined on the chart (zoomed in) with the neckline of double top pattern at 1.3184 should to be watched along the way.
It’s also worth noting that, the pair broke below the uptrend line originated from the July 31 low at 1.3105 eyeing a test of 1.3144.
On the other hand, a close above the high end of the current trading zone, could push USDCAD towards 1.3357. Nonetheless, the weekly and daily resistance levels underscored on the chart would be worth monitoring. Further close above 1.3357 could send the price towards 1.3418. The weekly resistance area marked on the chart should be considered.
Having trouble with your trading strategy? Here’s the #1 Mistake That Traders Make
USD/CAD Four-HOUR PRICE CHART (July 30 – AUg 27, 2019)

Looking at the four-hour chart, we notice on Friday USD/CAD spiked and completed the third top of triple top pattern eyeing a break out of the neckline residing at 1.3254 .
On Monday, sellers pressed the price successfully below the triple top neckline. Hence, if USDCAD breaks below 1.3184 this suggests the price may fall towards 1.3144 however, the low end of the aforementioned trading zone should be kept in focus. See the chart to know more about lower support levels USDCAD would encounter in further bearish scenario.
On the flip-side, if USDCAD rallies above 1.3280 it might resume bullish price action towards 1.3338. Although, the daily resistance level underlined on the chart needs to be watched closely. See the chart to find out more about the higher resistance levels USD/CAD would face in a further bullish scenario.
Written By: Mahmoud Alkudsi
Please feel free to contact me on Twitter: @Malkudsi


